


Introduction
In today’s competitive business landscape, organizations constantly seek ways to streamline operations, enhance communication, and drive efficiency. Business Process Model and Notation (BPMN) has emerged as the gold standard for visualizing workflows, but the real challenge lies in finding the right tool to bring these diagrams to life. After extensive hands-on experience with various BPMN modeling solutions, Visual Paradigm has consistently stood out as a comprehensive platform that bridges the gap between theoretical process modeling and practical business transformation. This guide shares real-world insights into leveraging BPMN effectively and explores how Visual Paradigm’s feature set addresses the everyday challenges faced by business analysts, process architects, and organizational leaders.
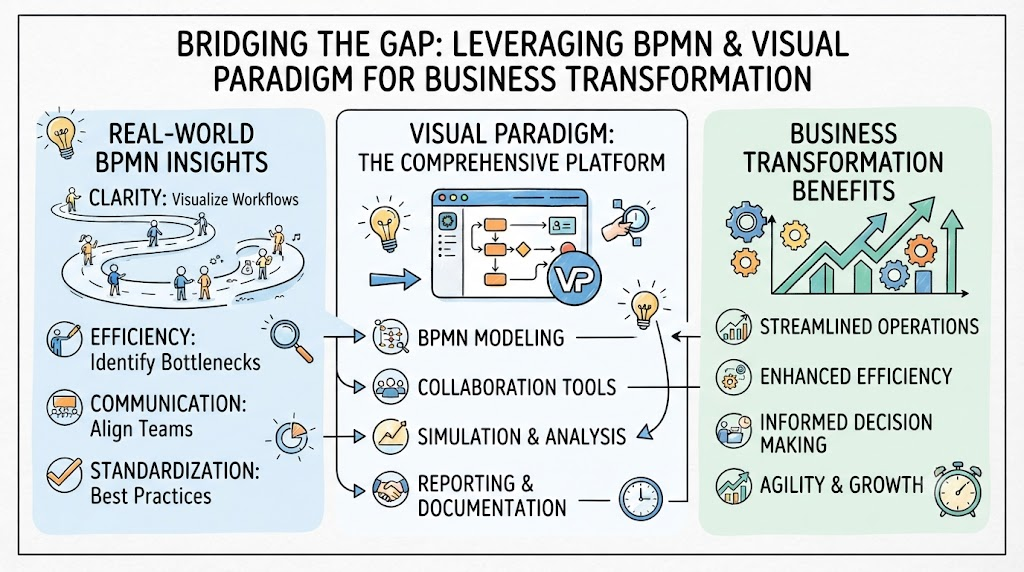
Understanding BPMN: The Universal Language of Business Processes
Business Process Model and Notation (BPMN) serves as a standardized graphical representation for specifying business processes in workflows. Developed by the Object Management Group (OMG), BPMN provides a visual language that transcends technical jargon, making it easily understandable by all stakeholders—from business analysts and technical developers to business managers and executive leadership.
The beauty of BPMN lies in its ability to create a common visual vocabulary that eliminates ambiguity in process documentation. Whether you’re mapping out a simple approval workflow or orchestrating complex multi-departmental operations, BPMN diagrams provide clarity that text-based descriptions simply cannot match.
Core BPMN Building Blocks
Flow Objects: The Heart of Your Process
Every BPMN diagram revolves around three fundamental flow objects that define what happens in your process:
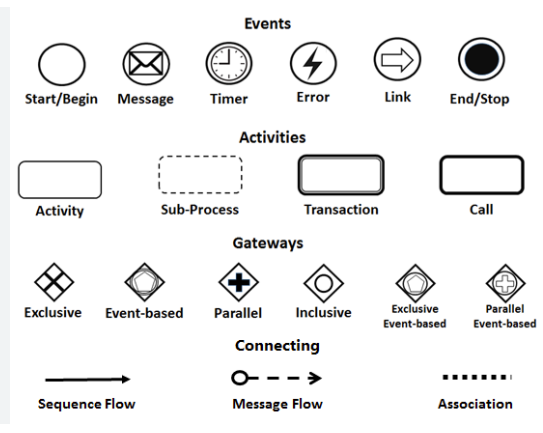
Events represent something that happens during the process lifecycle. These can be start events that trigger the process, intermediate events that occur during execution, or end events that mark completion. Events are the anchors that give your process temporal boundaries.
Activities encompass the actual work performed in the process. These range from simple tasks to complex sub-processes, representing the actionable steps that move your process forward. Whether it’s a user task requiring human intervention, a service task automated by a system, or a manual task performed without system support, activities are where the real work happens.
Gateways serve as decision points that control the flow based on specific conditions. They determine which path the process takes, enabling branching logic, parallel execution, or inclusive decision-making. Gateways are crucial for modeling real-world business rules and conditional workflows.
Connecting Objects: Mapping the Journey
The flow objects don’t exist in isolation—they’re connected through carefully defined relationships:
Sequence Flows appear as solid lines with arrows, indicating the precise order in which activities occur. They show the progression from one step to the next, creating the backbone of your process logic.
Message Flows are represented by dashed lines and show communication between different participants or organizational boundaries. These are essential when modeling interactions between separate pools, such as communication between different departments or external partners.
Swimlanes: Clarifying Responsibilities
One of BPMN’s most powerful organizational features is the swimlane concept:
Pools represent major participants in a process, such as entire departments, organizations, or external entities. They create clear boundaries that separate different actors in the process ecosystem.
Lanes are subdivisions within pools that specify responsibilities for particular tasks or roles. By organizing activities into lanes, you create immediate visual clarity about who does what, eliminating confusion about accountability and ownership.
Crafting Your First BPMN Diagram: A Step-by-Step Journey
Step 1: Define Your Process Scope
Before opening any modeling tool, start by clearly defining the business process you want to model. Identify the start and end points, map out key activities, and pinpoint critical decision moments. This conceptual clarity prevents scope creep and ensures your diagram remains focused and useful.
Step 2: Select Your Modeling Environment
Choosing the right BPMN tool can make or break your modeling experience. Popular options in the market include Lucidchart for quick diagrams, Camunda Modeler for execution-ready processes, and ProcessMaker for workflow automation. However, for comprehensive business process management that goes beyond simple diagramming, Visual Paradigm offers a robust solution that combines ease of use with enterprise-grade capabilities.
Step 3: Place Your Flow Objects
Begin building your diagram by strategically placing flow objects:
Start with a Start Event to mark where your process begins. This sets the stage for everything that follows.
Add Activities for each task that needs to be performed. Be specific and action-oriented in your task names.
Insert Gateways at decision points where the process flow can branch based on conditions or where parallel paths are needed.
Step 4: Establish Connections
Use sequence flows to connect your flow objects in the logical order they occur. Pay attention to the direction of arrows and ensure the flow makes business sense. When depicting communication between different pools or organizational boundaries, switch to message flows to maintain clarity about inter-party interactions.
Step 5: Organize with Swimlanes
Utilize pools and lanes to clarify roles and responsibilities within your process. Name each pool and lane appropriately to reflect their functions. This organizational structure transforms a simple flowchart into a responsibility matrix that immediately communicates who owns each part of the process.
Step 6: Review and Refine
Once your diagram is complete, step back and review it for clarity and accuracy. Share it with stakeholders who weren’t involved in creating it—if they can understand the process flow without extensive explanation, you’ve succeeded. Iterate based on feedback, simplifying where possible and adding detail where necessary.
Visual Paradigm: A Comprehensive Review from a Practitioner’s Perspective
First Impressions and Usability
After working with Visual Paradigm extensively for BPMN modeling, what strikes you immediately is the balance between power and accessibility. The interface doesn’t overwhelm newcomers with endless options, yet it doesn’t constrain experienced modelers with oversimplified tools. The learning curve is gentle enough that business analysts can become productive quickly, while the depth of features satisfies IT architects who need precision and control.

The Intuitive BPMN 2.0 Modeler
Visual Paradigm’s BPMN 2.0 modeler lives up to its promise of being intuitive. Creating professional Business Process Diagrams feels natural rather than mechanical. The drag-and-drop interface is responsive, and the smart connectors automatically adjust as you move elements around. Whether you’re a seasoned BPMN professional or someone new to process modeling, the user-friendly interface ensures a seamless experience without sacrificing the rigor of BPMN 2.0 standards compliance.
What’s particularly impressive is how the tool enforces BPMN rules without being pedantic. It guides you toward valid models while still allowing the flexibility to explore different modeling approaches. This balance is crucial for teams with varying levels of BPMN expertise.
Process Drill-Down: Managing Complexity Gracefully
One of the standout features that separates Visual Paradigm from basic diagramming tools is the Process Drill-Down capability. In real-world business processes, you often encounter complexity that can’t be adequately represented in a single diagram. The ability to “open up” a sub-process and model the lower level of process flow in another business process diagram is invaluable.

This hierarchical approach allows you to maintain a clean, high-level view for executive stakeholders while providing the ability to drill down into operational details when needed. You can easily collapse sub-processes to hide details during high-level discussions or expand them to view lower-level process flows when working through implementation details. This flexibility provides a comprehensive view of workflows without overwhelming any single diagram.
Integration Beyond BPMN: A True Modeling Ecosystem
Visual Paradigm distinguishes itself as an all-rounded visual modeling tool that supports a wide range of diagrams and integrates them to maximize the effectiveness of visual modeling. In practical process design work, you rarely work in isolation with just BPMN. You need to map process flows with other modeling artifacts such as UML shapes for system design, ERD entities for database structures, wireframes for user interfaces, and more.

This flexibility ensures that you can tailor your models to fit specific needs without being confined to a single notation. The ability to create connections between BPMN elements and other modeling standards means your process models don’t exist in a vacuum—they’re part of a comprehensive enterprise architecture that connects business processes to systems, data, and user experiences.
Working Procedure Editor: Bridging Diagrams and Documentation
While a Business Process Diagram provides a bird’s eye view of a business process, the operational procedures of individual business activities often require more detailed specification. This is where Visual Paradigm’s Working Procedure Editor shines. It allows you to output a process specification that contains both the process diagram and the detailed working procedures, making it easy to share comprehensive guidelines with your team.
This feature addresses a common pain point in process modeling: the gap between high-level visual diagrams and the detailed procedural documentation that teams actually need to execute processes. By integrating both in one tool, you maintain consistency and reduce the maintenance burden of keeping separate documents in sync.
As-is and To-be Process Modeling: Supporting Transformation
Process improvement initiatives require you to understand where you are before you can plan where you’re going. Visual Paradigm enables you to produce a target process model (To-be) from the baseline (As-is) and start editing the target to represent the expected result of process improvement or re-engineering.

What makes this particularly powerful is that traceability is maintained in the background, allowing you to navigate through the two models smoothly. You can easily compare the current state with the future state, track what’s changing, and communicate the transformation journey to stakeholders. This capability is essential for change management and ensuring that process improvement initiatives deliver measurable results.
RACI and CRUD Charts: Clarifying Accountability
Process diagrams show what happens and in what order, but they don’t always make accountability crystal clear. This is where RACI charts become invaluable. RACI charts are matrices that present the different responsibilities of diverse people, teams, departments, or any other business units in completing business activities.

Visual Paradigm allows you to create RACI charts with rows of participants and columns of business activities, marking cells with letters R (Responsible), A (Accountable), C (Consulted), or I (Informed) to represent specific responsibilities. Additionally, you can create CRUD charts (Create, Read, Update, Delete) or any custom chart to suit your needs. This feature transforms your process models from simple flow diagrams into comprehensive governance tools that eliminate ambiguity about who does what.
Process Animation: Bringing Static Diagrams to Life
One of the most innovative features that sets Visual Paradigm apart is Process Animation. Static diagrams, no matter how well-designed, have limitations when it comes to communicating how a process actually flows. Process Animation clears the barrier encountered in studying process flows with static images by analyzing process flows and converting them into animations.
These animations can be viewed in motion by you, your clients, and colleagues, providing a dynamic way to understand workflows. This is particularly valuable when presenting to stakeholders who may not be familiar with BPMN notation or when training teams on new processes. Seeing the process “in action” makes abstract concepts concrete and helps identify potential issues that might not be obvious in a static diagram.
Process Simulation: Testing Before Implementation
Perhaps the most powerful feature for serious process improvement work is Process Simulation. This capability allows you to visually simulate the execution of business processes to study resource consumption, evaluate costs, identify bottlenecks, and trial run possible process improvement options.
With features like resource allocation, configurable time scales, cost evaluation, completion charts, resource usage charts, and queue time charts, you can gain deep insights into your processes before implementing changes. This is invaluable for avoiding costly mistakes and ensuring that process improvements actually deliver the expected benefits. You can test different scenarios, compare alternatives, and make data-driven decisions about process design.
Best Practices for Effective BPMN Modeling
Based on practical experience with Visual Paradigm and BPMN modeling in general, several best practices consistently prove valuable:
Keep It Simple: Aim for clarity over complexity. Avoid overcrowding your diagram with too many elements. If a diagram becomes too complex, use sub-processes to break it into manageable chunks.
Use Standard Notations: Adhere to BPMN standards to ensure consistency and understanding across different users. Visual Paradigm’s compliance with BPMN 2.0 makes this easier, but discipline is still required.
Label Clearly: Use descriptive labels for activities and events to enhance comprehension. Avoid vague terms and be specific about what each element represents.
Iterate Based on Feedback: Share your diagram with stakeholders for feedback and make necessary adjustments. Process modeling is collaborative, and diverse perspectives improve the final result.
Leverage Swimlanes Wisely: Use pools and lanes to clarify responsibilities, but don’t create so many lanes that the diagram becomes fragmented. Group related roles together when appropriate.
Document Assumptions: Use text annotations and data objects to capture important context that isn’t obvious from the flow alone.
Validate with Simulation: Before finalizing complex processes, use simulation features to test the logic and identify potential issues.
Advanced Features That Make a Difference
AI-Powered Productivity
Visual Paradigm has integrated AI capabilities that genuinely enhance productivity. The AI Text-to-Diagram Generator interprets natural language descriptions of business procedures and instantly drafts fully interactive, editable BPMN maps with correct swimlanes and logic. This isn’t just a gimmick—it’s a practical tool that accelerates the initial modeling phase, allowing you to start from a solid foundation rather than a blank canvas.
Resource Catalog for Rapid Modeling
The Resource Catalog is a subtle but powerful productivity feature. It’s a quick-access context menu that allows you to drag from an existing shape to instantly spawn and connect the next logical element, saving significant drafting time. Once you get used to this workflow, going back to traditional drag-and-drop from a palette feels unnecessarily slow.
Model Element Referencing and Traceability
In enterprise environments, process models don’t exist in isolation. Visual Paradigm makes it easy to bind any block or shape to supplemental materials like local files, folders, web URLs, or other internal diagrams to maintain direct traceability. This feature ensures that your process models remain connected to the broader ecosystem of enterprise documentation and systems.
Performance Statistics and Metrics
The ability to track metrics directly inside your maps, giving summary reports on process costs, estimated processing hours, and message counts, helps identify systemic operational bottlenecks. This transforms your diagrams from static documentation into living analytical tools that support continuous improvement.
Conclusion
Business Process Model and Notation has proven itself as an indispensable tool for visualizing business processes, facilitating communication among stakeholders, and driving operational efficiency. However, the true value of BPMN is only realized when paired with the right modeling tool. Visual Paradigm has demonstrated itself to be far more than just a diagramming application—it’s a comprehensive business process management platform that empowers organizations to analyze, improve, and optimize their workflows.
What sets Visual Paradigm apart is its thoughtful balance of accessibility and power. It welcomes newcomers with an intuitive interface while providing the depth and sophistication that experienced practitioners demand. Features like Process Drill-Down, As-is to To-be modeling, Process Animation, and Simulation transform BPMN from a documentation exercise into a strategic tool for organizational transformation.
The integration capabilities that extend beyond BPMN to UML, ERD, wireframes, and other modeling standards reflect the reality of modern business analysis: processes don’t exist in isolation. They’re part of a complex ecosystem that includes systems, data, user experiences, and organizational structures. Visual Paradigm’s ability to connect these dots makes it an invaluable asset for enterprise architects and business analysts alike.
For organizations serious about process excellence, Visual Paradigm offers more than just a tool—it provides a framework for continuous improvement, a common language for cross-functional collaboration, and the analytical capabilities to turn process insights into measurable results. The investment in learning and implementing Visual Paradigm pays dividends in clearer communication, better decision-making, and more successful process transformation initiatives.
Whether you’re embarking on your first BPMN modeling project or looking to elevate your organization’s process management capabilities, Visual Paradigm provides the comprehensive solution needed to turn process complexity into competitive advantage.
References
-
BPMN for Beginners: A Complete Guide to Business Process Modeling Notation: Comprehensive introduction to BPMN concepts and modeling fundamentals
-
Process Design Tool Features: Overview of Visual Paradigm’s process design capabilities and tools
-
BPMN Made Easy: Guide to simplifying BPMN modeling with Visual Paradigm
-
Visual Paradigm BPMN Tutorial Video: Video walkthrough of BPMN modeling techniques
-
Project Management Learning Resources: Educational materials for project and process management
-
Complete BPMN Guide: Comprehensive BPMN reference and modeling guide
-
BPMN Standards and Notation: Detailed coverage of BPMN notation standards
-
BPMN Activity Types Explained: In-depth explanation of different BPMN activity types
-
Comprehensive Guide to BPMN: Key Concepts, Benefits and Use Cases: Complete overview of BPMN concepts and practical applications
-
Sequence and Message Flows Documentation: Technical documentation on connecting objects in BPMN
-
BPMN Tutorial Series: Step-by-step BPMN modeling tutorials
-
Data Objects in BPMN: Guide to using data objects and artifacts in process models
-
Getting Started with BPMN: Beginner’s tutorial for creating BPMN diagrams
-
BPMN Artifacts for Better Process Models: Article on enhancing process model clarity with artifacts
-
From Narrative to Diagram: AI BPMN Generator: Guide to AI-powered text-to-diagram generation
-
BPMN Diagram and Tools Features: Overview of BPMN diagramming tools and capabilities
-
Visual Paradigm Complete Features: Comprehensive list of all Visual Paradigm features
-
Drawing Business Process Diagrams: User guide for creating business process diagrams
Related posts:
 Mastering BPMN: A Comprehensive Guide to Core Flow Objects and Process Modeling
 The Comprehensive Guide to BPMN: Enhancing Efficiency and Productivity with Visual Paradigm BPMN + AI
 Mastering BPMN: A Comprehensive Guide to Business Process Modeling and Notation
 The Consultant’s Playbook: Conducting Live Process Mapping Workshops with AI
