
Architecting the Future: VPasCode and AI Chatbots for ArchiMate Traceability
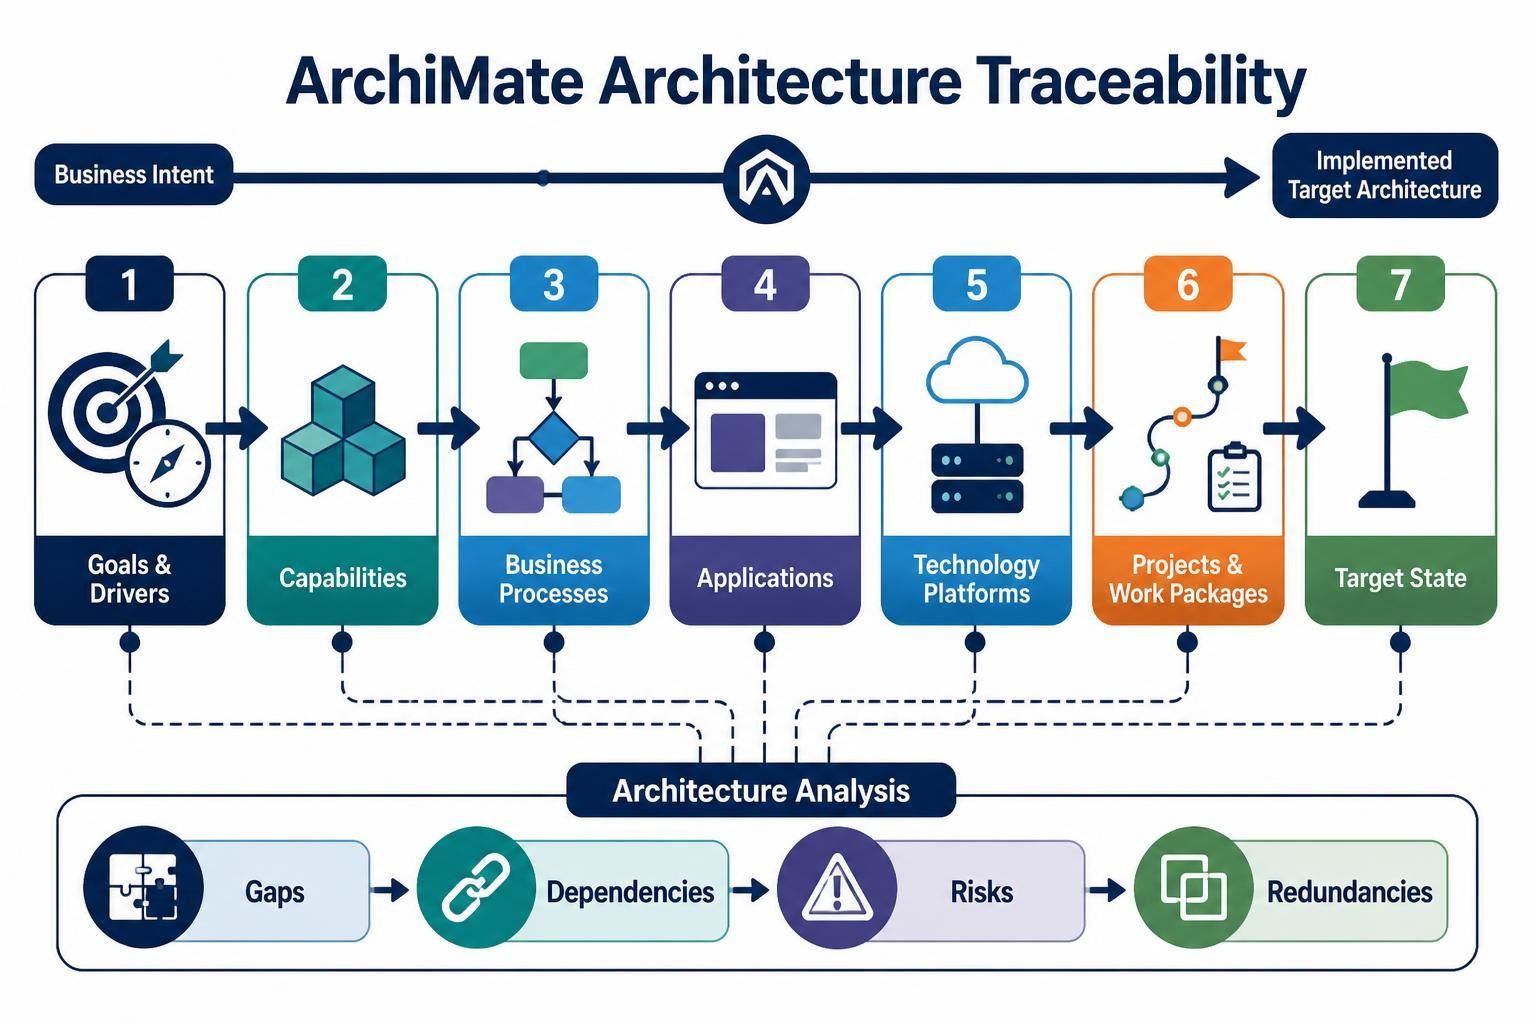
In the complex world of Enterprise Architecture (EA), connecting the abstract “why” of business strategy to the concrete “how” of technology implementation is often the most challenging task. ArchiMate provides the universal language to bridge this gap, ensuring that every line of code and server configuration can be traced back to a specific business driver.
This tutorial walks you through the ArchiMate Architecture Traceability lifecycle, analyzing the seven-step flow from “Business Intent” to “Implemented Target Architecture.” We will break down each architectural layer and discuss how tools like Visual Paradigm and the ArchiMate specification work together to ensure organizational alignment.
The Strategic Flow: From Driver to Goal
The journey begins at the top of the architecture stack, where the focus is on Business Intent. This layer is not about “how we build” but rather “why we exist.”
1. Goals & Drivers
Before any software is designed, we must understand the forces at play. ArchiMate distinguishes between:
- Drivers: The external or internal forces prompting change (e.g., new regulations, market competition).
- Goals: The desired outcomes the organization wants to achieve in response to those drivers.
Visual Check: In the diagram, this is represented by the target icon. It is the anchor point. If a project does not support a Goal, or a Goal is not supported by a Driver, the architecture is unbalanced.
2. Capabilities
Once goals are defined, we identify the Capabilities. A capability is “what” an organization does, rather than “how” it does it. It is a stable attribute of the organization.
- Concept: If the Goal is “Increase Customer Satisfaction,” a supporting Capability might be “Customer Service Management.”
- Mapping: Capabilities sit above processes. They define the capacity to deliver services.
Operationalizing Strategy: Process to Application
As we move deeper into the layers, the abstraction becomes more concrete. We transition from “what we can do” to “what we are doing.”
3. Business Processes
Capabilities are realized through Business Processes. These are sequences of activities that add value.
- The Flow: A process (e.g., “Process Order”) consumes inputs and produces outputs.
- Traceability: This is where the “chain” begins to form. We ask: “Which specific application supports this specific process step?”
4. Applications
The Application Layer represents the software systems that support the business processes. In ArchiMate, this includes:
- Application Services: What the software offers to the business (e.g., “Validate Customer”).
- Application Components: The internal building blocks of the software (e.g., “Order Database Module”).
Note: The diagram shows a browser-like icon here, symbolizing the user interface or the application environment itself.
Infrastructure and Execution
The bottom layers of the diagram represent the technical foundation and the execution plan.
5. Technology Platforms
Applications do not exist in a vacuum; they run on Technology Platforms. This layer includes:
- Hardware: Servers, nodes, and mobile devices.
- System Software: Operating systems, databases, and middleware.
Key Concept: This layer is the most volatile. While business goals change slowly, the technology platform may be upgraded annually. However, the application service it hosts should remain stable.
6. Projects & Work Packages
This is the bridge between the “As-Is” architecture and the “To-Be” architecture. Projects and Work Packages are the mechanisms used to implement the target state.
- Implementation: These are the tangible deliverables (e.g., “Migrate to Cloud,” “Build New API Gateway”).
- Roadmap: They define the timeline and resources required to close the gap between current and target capabilities.
The Target State & Analysis
7. Target State
The final step is the Target State (the green flag). This represents the successful implementation of the architecture. It is the realization of the original Business Intent.
Architecture Analysis: The Underlying Logic
Below the main 7-step flow, the diagram highlights the critical analysis phase: Gaps, Dependencies, Risks, and Redundancies.
- Gaps: Missing capabilities or applications needed to reach the goal.
- Dependencies: Critical links where one application relies on another.
- Risks: Potential points of failure in the technology or process chain.
- Redundancies: Duplicate capabilities or systems that waste resources.
Tooling: Visual Paradigm & ArchiMate
To effectively model this complex traceability, architects rely on robust tooling. Visual Paradigm is a leading enterprise architecture tool that natively supports the ArchiMate standard.
Why Use Visual Paradigm for ArchiMate?
Visual Paradigm (VP) offers a suite of features that automate the traceability logic described above:
- Standard Compliance: VP ensures that the shapes, colors, and relationship lines strictly adhere to the ArchiMate 3.x/4.x specifications, preventing modeling errors.
- Automated Traceability: When you model a dependency between a Business Process and an Application Component, VP automatically tracks the impact. If you change the Goal, you can instantly see which Processes and Applications are affected.
- Gap Analysis Reports: VP can generate reports that visualize the “Architecture Analysis” layer, highlighting missing links between Drivers and Technology.
- Collaboration: It allows multiple stakeholders (Business Analysts and IT Architects) to work on the same model, ensuring the “Language” of the organization is unified.
By combining the structured methodology of ArchiMate with the automation of Visual Paradigm, organizations can transform their architecture from static diagrams into dynamic, strategic assets.