


In modern software development and agile methodologies, the user story serves as the fundamental unit of work. It represents a feature or requirement described from the perspective of the end user. However, simply moving tickets from “To Do” to “Done” does not inherently signal project success. True measurement requires a deeper analysis of what “completed” actually means, how the work contributes to business goals, and the quality of the delivery. This guide explores the framework for measuring success through completed user stories without relying on vanity metrics or superficial progress indicators.
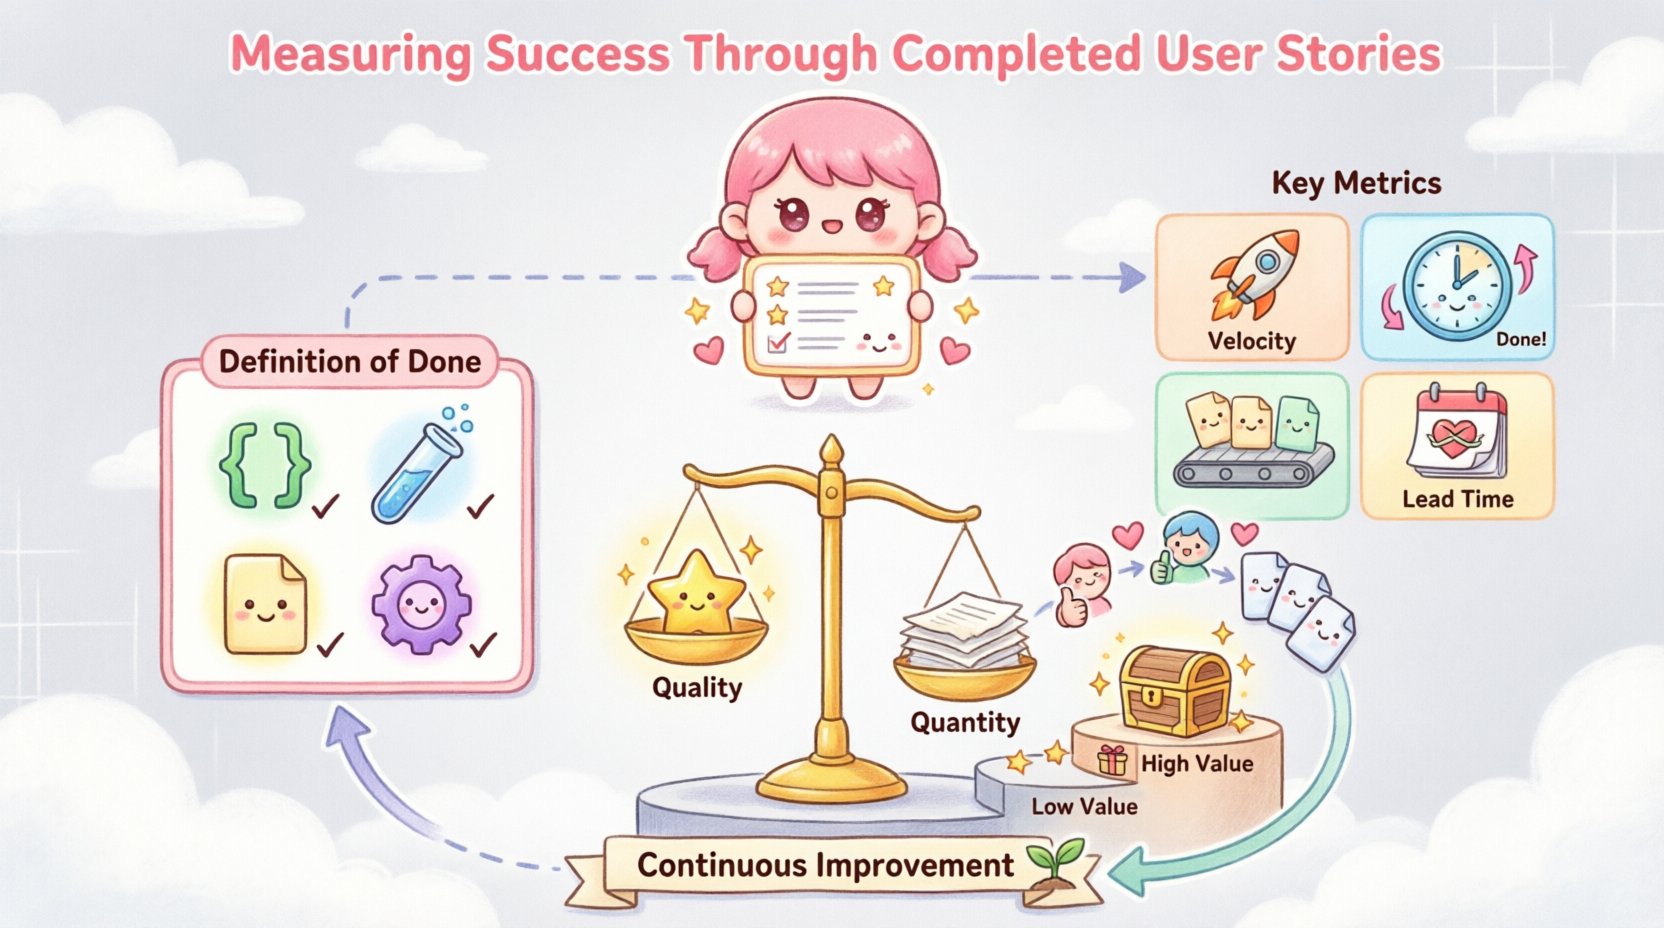
Understanding the Definition of Done 🛑
Before measuring success, teams must establish a clear baseline for completion. The Definition of Done (DoD) is a shared agreement within the team that specifies the criteria a user story must meet to be considered complete. Without this standard, one developer might mark a story as done after writing code, while another might wait for testing, documentation, and deployment. This discrepancy creates noise in data and obscures the true status of a project.
A robust DoD ensures consistency across the board. It typically includes:
- Code has been written according to style guidelines.
- Unit tests have been created and passed.
- Integration tests have been executed successfully.
- Code review has been completed by a peer.
- Documentation has been updated to reflect the change.
- Performance requirements have been validated.
- Accessibility standards have been met.
When a user story crosses the finish line, it should satisfy every item in this checklist. Measuring success starts with adherence to this standard. If a team reports high completion rates but quality issues emerge post-release, the Definition of Done was likely too loose or ignored.
Key Metrics for Completed Stories 📊
Once the Definition of Done is established, teams can look at specific metrics to gauge performance. These metrics help identify bottlenecks, predict future capacity, and assess the health of the delivery pipeline. It is important to select metrics that drive improvement rather than punishment.
1. Velocity
Velocity is the most common metric used to track the amount of work a team completes in a sprint. It is calculated by summing the story points of all completed user stories. Over time, this number stabilizes, providing a reliable baseline for planning.
- High Velocity: Indicates the team is moving quickly, but it must be weighed against quality.
- Fluctuating Velocity: Suggests instability in the environment, unclear requirements, or external interruptions.
- Consistent Velocity: The ideal state, allowing for accurate forecasting of delivery dates.
2. Cycle Time
Cycle time measures how long it takes for a user story to move from “In Progress” to “Done.” This metric focuses on efficiency and flow. A shorter cycle time generally means faster feedback loops and quicker value delivery to stakeholders.
3. Throughput
Throughput counts the number of user stories completed within a specific time period, regardless of story points. This is useful for teams that do not use story points or for measuring raw output volume.
4. Lead Time
Lead time measures the total time from when a user story is requested (or created) until it is delivered to the user. This metric includes wait times in the backlog and is crucial for understanding customer wait times.
| Metric | What It Measures | Best Used For |
|---|---|---|
| Velocity | Work capacity per sprint | Planning and forecasting |
| Cycle Time | Efficiency of execution | Process optimization |
| Throughput | Volume of completed items | Capacity analysis |
| Lead Time | Total delivery time | Customer satisfaction |
Quality vs. Quantity 🎯
A common pitfall in measuring success is prioritizing quantity over quality. A team might complete 50 user stories in a month, but if 20 of them contain critical bugs, the success rate is low. The goal is not just to finish tasks, but to finish them in a state that provides value without technical debt.
To balance this, teams should track:
- Escaped Defects: The number of bugs found in production that should have been caught during the Definition of Done.
- Rework Rate: How often a story is reopened after being marked complete.
- Test Coverage: The percentage of code covered by automated tests.
If the completed user stories are accumulating technical debt, the long-term velocity will inevitably drop. Success is sustainable delivery, not short-term bursts of activity.
Velocity and Predictability 🔄
Predictability is often more valuable than raw speed. Stakeholders need to know when they can expect features. A team with moderate velocity but high predictability is often more trusted than a team with high velocity but unpredictable delivery.
To improve predictability, teams should analyze their completion history over multiple sprints. Outliers should be investigated. Did a story take longer than expected due to a dependency? Was the scope unclear? Understanding the variance helps refine the Definition of Done and the estimation process.
When measuring success through completed user stories, look for trends over time rather than single data points. A single slow sprint might be an anomaly, but a trend of slowing completion rates indicates a systemic issue.
Common Measurement Traps ⚠️
While data is powerful, it can be misused. Teams must be aware of the psychological impact of metrics. When measurement becomes a weapon, behavior changes to game the system rather than improve the product.
Padding Estimates
If story points are directly linked to performance reviews, developers may pad their estimates to ensure they look good. This distorts velocity and makes planning inaccurate. Estimates should be relative, not absolute targets.
Definition of Done Creep
Teams sometimes add tasks to the Definition of Done to make stories appear more complex, artificially inflating points. This practice destroys the integrity of the data and should be avoided.
Ignoring Incomplete Work
It is tempting to count a story as done if 90% of the work is finished. However, an incomplete story provides no value. It is better to count zero and understand the blocker than to inflate the numbers.
Integrating Feedback Loops 🔄
A completed user story is not truly successful until it provides value to the user. This requires integrating feedback loops into the measurement process. Just because the code is merged does not mean the feature is working as intended in the real world.
Successful measurement includes:
- User Adoption Rates: Are people using the feature?
- Support Tickets: Is the feature causing confusion or errors?
- Customer Satisfaction: Surveys or feedback forms regarding the new functionality.
If a user story is completed but users do not adopt it, the team has failed to deliver value, even if the technical definition of done was met. This highlights the difference between output (shipping code) and outcome (solving a problem).
Strategic Value Assessment 💰
Not all user stories carry the same weight. A story that fixes a critical security vulnerability is more valuable than a story that changes a button color. Measuring success should account for the priority and impact of the work completed.
Teams can categorize stories based on value:
- High Value: Core features that drive revenue or retention.
- Medium Value: Enhancements that improve user experience.
- Low Value: Maintenance tasks or minor tweaks.
When analyzing completed work, calculate the ratio of high-value stories delivered. If a team spends all their time on low-value maintenance, they may be moving fast but not moving forward strategically.
Reporting and Visualization 📈
Data is only useful if it is understood. Dashboards and reports should visualize the metrics discussed above in a way that is accessible to the whole team and stakeholders.
- Burndown Charts: Show progress within a sprint.
- Control Charts: Show cycle time stability over time.
- Cumulative Flow Diagrams: Visualize work in progress and bottlenecks.
Visuals help identify trends that raw numbers might hide. For example, a control chart might show that cycle time is increasing even if velocity remains stable, indicating a growing backlog or complexity.
Team Autonomy in Measurement ❤️
Who defines what success looks like? Ideally, the team itself should define and own their metrics. When management imposes metrics without team input, trust erodes. Teams need the autonomy to adjust their Definition of Done and measurement practices as they learn.
This autonomy fosters a culture of continuous improvement. When the team owns the data, they are more likely to use it to solve problems rather than feel pressured by it.
Continuous Improvement 🌱
Measurement is not a one-time activity. It is an ongoing practice that evolves with the team. Regular retrospectives should include a review of the metrics. Are they still accurate? Are they helpful? Do they drive the right behaviors?
If a metric stops providing value, retire it. The goal is to maintain a lean set of measurements that illuminate the path forward. Success is measured by the ability to adapt and improve the delivery process continuously.
Stakeholder Communication 🗣️
Finally, how success is communicated matters. Stakeholders need to understand the context behind the numbers. A drop in velocity might mean the team is tackling harder problems, not that they are slower. A spike in bugs might mean the team is expanding the Definition of Done.
Transparency builds trust. When stakeholders understand the metrics and the definitions behind them, they become partners in the success measurement process rather than critics.
Final Considerations for Sustainable Success
Measuring success through completed user stories is a balance of art and science. It requires technical rigor to ensure the Definition of Done is met, data discipline to track the right metrics, and human insight to interpret the results in the context of business value. By avoiding vanity metrics and focusing on quality, flow, and value, teams can create a reliable system for delivering software.
The ultimate goal is not to have perfect numbers, but to have a predictable, high-quality flow of value to the customer. When the data supports this flow, the team is succeeding. When the data reveals friction, the team has an opportunity to improve. This cycle of measurement and adjustment is the heart of a mature agile practice.
Start with a clear Definition of Done. Track metrics that matter. Protect quality. Listen to the data. And always remember that the numbers serve the team, not the other way around. With this approach, measuring success becomes a tool for empowerment and continuous growth rather than a source of pressure.

