


In the modern digital landscape, organizations are drowning in information. We have access to clickstreams, session durations, conversion rates, and demographic profiles. Yet, knowing what a customer did often falls short of explaining why they did it. This gap between raw metrics and human behavior is where the true value lies. To bridge this divide, we must move beyond spreadsheets and dashboards. We must learn the art of journey mapping.
Journey mapping is not merely a visualization exercise. It is a strategic discipline that transforms fragmented data points into a coherent narrative. When executed with precision, it reveals the emotional undercurrents driving user decisions. It turns cold statistics into warm stories that teams across the organization can understand and act upon. This guide explores how to extract meaning from data and craft a story that drives tangible improvement.
Why Numbers Alone Fail to Tell the Whole Story 📊
Data is essential, but it is rarely sufficient on its own. Consider a scenario where a checkout page shows a high drop-off rate. The number tells you there is a problem. It does not tell you if the user was confused by the form, frustrated by the loading speed, or simply hesitant about shipping costs. Without context, the number is just a statistic.
Reliance on quantitative data creates a blind spot. It captures the what, but misses the how and the why. This is where qualitative insights become critical. Combining behavioral data with emotional context creates a complete picture. Here is why a narrative approach is necessary:
- Contextual Clarity: Numbers indicate anomalies; stories explain them.
- Empathy Generation: Teams connect with human struggles more than they do with percentages.
- Actionable Insights: A story highlights specific friction points that require design intervention.
- Alignment: A shared narrative aligns product, marketing, and support teams around a single vision.
When we treat data as a story, we stop asking “What is the conversion rate?” and start asking “What is the experience leading to this conversion?” This shift in perspective is the foundation of effective journey mapping.
Defining the Customer Journey Map 🗺️
A customer journey map is a visual artifact that illustrates the steps a customer takes to achieve a goal. It documents their experience across every touchpoint and channel. However, a map is only as good as the data and insights that populate it. It serves as a shared reference point for the organization.
At its core, a journey map answers three fundamental questions:
- Who is the persona? We must define the specific user segment we are analyzing.
- What is the goal? Every journey begins with an intent, such as purchasing a product or seeking support.
- How does it feel? Emotional states vary throughout the journey and dictate satisfaction levels.
The map is not static. It evolves as the business grows and customer behaviors shift. It is a living document that requires regular updates to remain accurate. By grounding the map in data, we ensure it reflects reality rather than assumption.
The Bridge Between Data and Emotion 🧠
Transforming data into a story requires synthesizing two distinct types of information: quantitative and qualitative. Neither is superior; they serve different purposes. Quantitative data provides scale and frequency, while qualitative data provides depth and nuance.
| Data Type | Characteristics | Role in Mapping | Example Sources |
|---|---|---|---|
| Quantitative | Measurable, numerical, scalable | Identifies trends and volume | Web analytics, CRM data, surveys |
| Qualitative | Descriptive, subjective, deep | Explains motivations and feelings | User interviews, support logs, usability tests |
When these two streams converge, the narrative becomes robust. For instance, analytics might show that users abandon a form at a specific field. An interview might reveal that the label is confusing or the validation error message is unclear. The data points to the location of the friction; the story explains the cause.
Step-by-Step: From Analytics to Narrative
Constructing a journey map is a deliberate process. It requires discipline to avoid jumping to conclusions. Follow these steps to ensure your narrative is grounded in evidence.
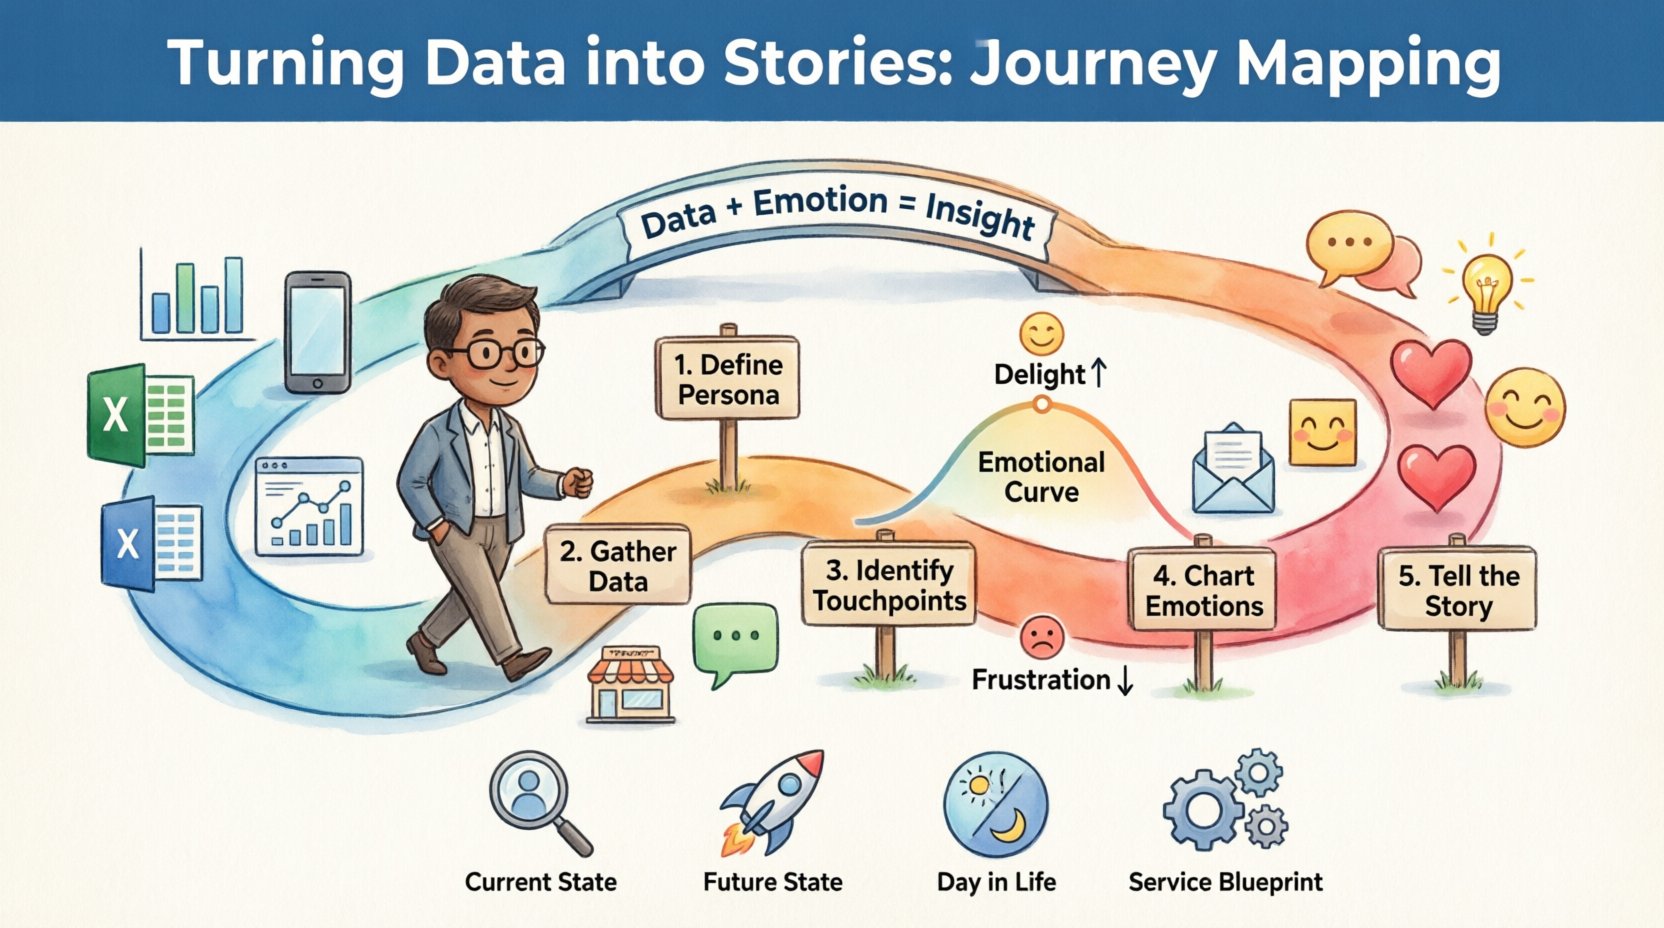
1. Define the Scope and Persona
Start by narrowing your focus. A journey map that tries to cover every possible user interaction will become too broad to be useful. Select a specific persona and a specific goal. For example, “A first-time buyer purchasing a subscription” is a better scope than “All users using the website.” This clarity allows you to gather relevant data.
2. Gather the Data
Collect information from multiple sources. Do not rely on a single channel. Look at:
- Behavioral Data: Where do users click? Where do they scroll? How long do they stay?
- Feedback Data: What are users saying in reviews or support tickets?
- Operational Data: What are the internal processes involved in fulfilling the request?
3. Identify Touchpoints and Channels
List every interaction the user has with your organization. This includes digital channels like websites and emails, as well as physical interactions like phone calls or in-person visits. Map these chronologically. Ensure you account for the transition points between channels.
4. Chart the Emotional Journey
Assign emotional states to each stage of the journey. Use a scale to measure sentiment, such as frustration, confusion, satisfaction, or delight. This visualizes the highs and lows of the experience. It highlights moments where the user feels positive and moments where they feel negative.
5. Synthesize Findings into a Narrative
Now, write the story. Describe the user’s thought process at each stage. What are they thinking? What are they feeling? Why do they proceed or stop? Use direct quotes from user interviews to bring the story to life. This humanizes the data.
Types of Maps You Should Know 🗺️
Different business needs require different types of maps. Understanding the variations helps you select the right tool for the job.
- Current State Map: Depicts the experience as it exists today. It is used to identify current pain points and inefficiencies.
- Future State Map: Envisions the ideal experience after improvements are made. It serves as a goal for the team.
- Day in the Life Map: Expands beyond direct interactions to include how the product fits into the user’s broader life context.
- Service Blueprint: A more complex map that includes backend processes and support systems that enable the front-end experience.
Choosing the right type depends on your objective. If you are auditing a process, a current state map is best. If you are planning a redesign, a future state map provides direction.
Pitfalls to Avoid 🚫
Even with the best intentions, journey mapping can go wrong. Common errors can undermine the entire initiative. Be vigilant against these traps.
- Assumption Over Evidence: Never map what you think is happening. Map what you know is happening. If you lack data, gather it first.
- Ignoring Internal Processes: A customer cannot experience what the backend cannot deliver. Include internal workflows in the analysis.
- Creating a Single Story: Different segments have different journeys. Avoid generalizing one persona’s experience for all users.
- Lack of Ownership: If no one owns the map, it becomes a static document on a shelf. Assign a stakeholder to maintain and update it.
- Overcomplication: Do not add excessive detail that obscures the main insights. Keep the focus on critical friction points.
Building an Empathy-First Culture 🤝
The most successful journey maps do more than identify problems; they shift the organizational culture. They foster empathy for the customer. When teams see the struggle of a user, they are more motivated to solve it.
To embed this mindset:
- Share the Map Widely: Display maps in meeting rooms and digital workspaces. Make them visible to everyone.
- Involve Cross-Functional Teams: Include representatives from sales, support, product, and engineering. Their perspectives add depth.
- Use the Map in Decision Making: Reference the journey when discussing new features or changes. Ask, “How does this fit into the story?”
- Validate Continuously: Treat the map as a hypothesis. Test it against real user behavior regularly.
Measuring Impact Without Hype 📈
Once changes are implemented based on the journey insights, you must measure the results. Avoid vanity metrics that look good on a slide but mean little in practice. Focus on metrics that reflect the user experience.
Key performance indicators might include:
- Task Success Rate: Can users complete the goal they intended to?
- Time on Task: Has the process become more efficient?
- Customer Satisfaction Score (CSAT): Do users feel happier with the outcome?
- Net Promoter Score (NPS): Are users more likely to recommend the service?
- Support Ticket Reduction: Have specific friction points been resolved?
Tracking these metrics over time creates a feedback loop. It confirms whether the narrative changes led to actual improvements. If the data does not move, revisit the map. Perhaps the story was not accurate, or the solution did not address the root cause.
The Role of Technology in Storytelling
Technology plays a supporting role in this process. Tools can help aggregate data and visualize touchpoints. However, the technology is not the strategy. It is a means to an end.
When selecting platforms for mapping, look for features that allow collaboration and integration. You need a space where stakeholders can comment and annotate. You need a system that pulls data from analytics platforms to keep the map current. But remember, the tool does not generate the insights. The team does.
Automation can help with data collection, but human interpretation is still required. Algorithms can flag anomalies, but humans must understand the context behind those anomalies. The story remains a human creation.
Final Thoughts on Narrative Design
The transition from data to story is a continuous journey. It requires patience, rigor, and a commitment to the customer. When you successfully turn data into stories, you create a shared language for your organization. You move from guessing to knowing.
Journey mapping is not a one-time project. It is a mindset. It demands that you listen to the data, but also listen to the people behind the data. By doing so, you create experiences that are not just functional, but meaningful. This is the true power of turning information into insight.
Start small. Pick one critical journey. Gather the evidence. Tell the story. Act on it. Then repeat. Over time, these small narratives will build a comprehensive understanding of your customers. That understanding is the foundation of sustainable growth.

