


In the modern digital landscape, customers do not interact with a brand through a single lens. They move between mobile devices, desktop browsers, physical stores, and social platforms seamlessly. Understanding this movement is critical for any organization aiming to deliver a cohesive experience. Cross-channel journey mapping provides the framework to visualize these interactions. It reveals how a customer perceives your brand across different touchpoints. Without this visibility, businesses often create silos that confuse users and damage retention. This guide outlines a structured method to build and maintain these maps effectively.
The process requires more than just drawing a line on a diagram. It demands a deep understanding of data, user psychology, and operational capabilities. We will explore the foundational elements, the practical steps to execution, and the ongoing maintenance required to keep the map relevant. By following this approach, teams can identify friction, optimize conversion paths, and align internal stakeholders around a unified customer view.
🧩 Understanding the Core Concept
A customer journey map is a visual representation of the steps a person takes to achieve a goal with your brand. When we add the cross-channel element, we acknowledge that these steps happen across various mediums. A user might see an advertisement on social media, research the product on a mobile app, and finalize the purchase in a physical location. Each interaction leaves a data trail. Mapping these trails helps organizations see the full picture rather than isolated incidents.
This approach shifts the focus from internal processes to external experiences. It asks questions like:
- How does the user feel when switching from email to the website?
- Is the information consistent across the chatbot and the call center?
- Are there gaps where the customer expects continuity but receives friction?
Answering these questions requires a disciplined approach. It involves gathering qualitative and quantitative data to build a narrative that reflects reality. The goal is not just to document what happens, but to understand why it happens. This insight drives strategic decisions that improve the overall ecosystem.
🎯 Why It Matters for Modern Business
Consumers today expect consistency. If a promotion is advertised on one platform but not honored on another, trust erodes quickly. Cross-channel mapping highlights these inconsistencies before they become public complaints. It serves as a diagnostic tool for operational health.
Key benefits include:
- Identifying Drop-off Points: You can see exactly where users abandon the process.
- Aligning Teams: Marketing, sales, and support see the same customer story.
- Optimizing Resources: Budget is directed to channels that actually drive value.
- Improving Retention: A smoother experience leads to higher loyalty.
When teams operate in silos, the customer experiences the disconnect. A unified map bridges these gaps. It ensures that the value proposition remains clear regardless of the medium used.
🛠️ Preparing Your Organization
Before drawing a single line, preparation is essential. Rushing into mapping without the right data or team alignment leads to inaccurate models. This phase sets the foundation for the entire project.
1. Define Clear Objectives
Start by asking what you hope to achieve. Is it to reduce churn? Increase average order value? Improve customer satisfaction scores? A vague goal leads to a vague map. Specificity drives utility. Write down the primary problem you are trying to solve.
2. Assemble a Cross-Functional Team
No single department owns the entire journey. You need representatives from:
- Product Management
- Customer Support
- Marketing
- Development
- Analytics
Each brings a unique perspective. Support knows the pain points. Product knows the features. Marketing knows the acquisition channels. Combining these views creates a holistic model.
3. Gather Available Data
Data is the fuel for this exercise. You need access to:
- Transaction logs
- Website analytics
- Customer feedback surveys
- Call center recordings
- Social media sentiment
Ensure data privacy compliance is maintained throughout the collection process. Anonymize sensitive information to protect user identity. The integrity of the data determines the accuracy of the map.
🚀 The Step-by-Step Process
With preparation complete, you can begin the mapping process. This section details the specific actions required to build a robust cross-channel model. Follow these steps sequentially to ensure logical flow and comprehensive coverage.
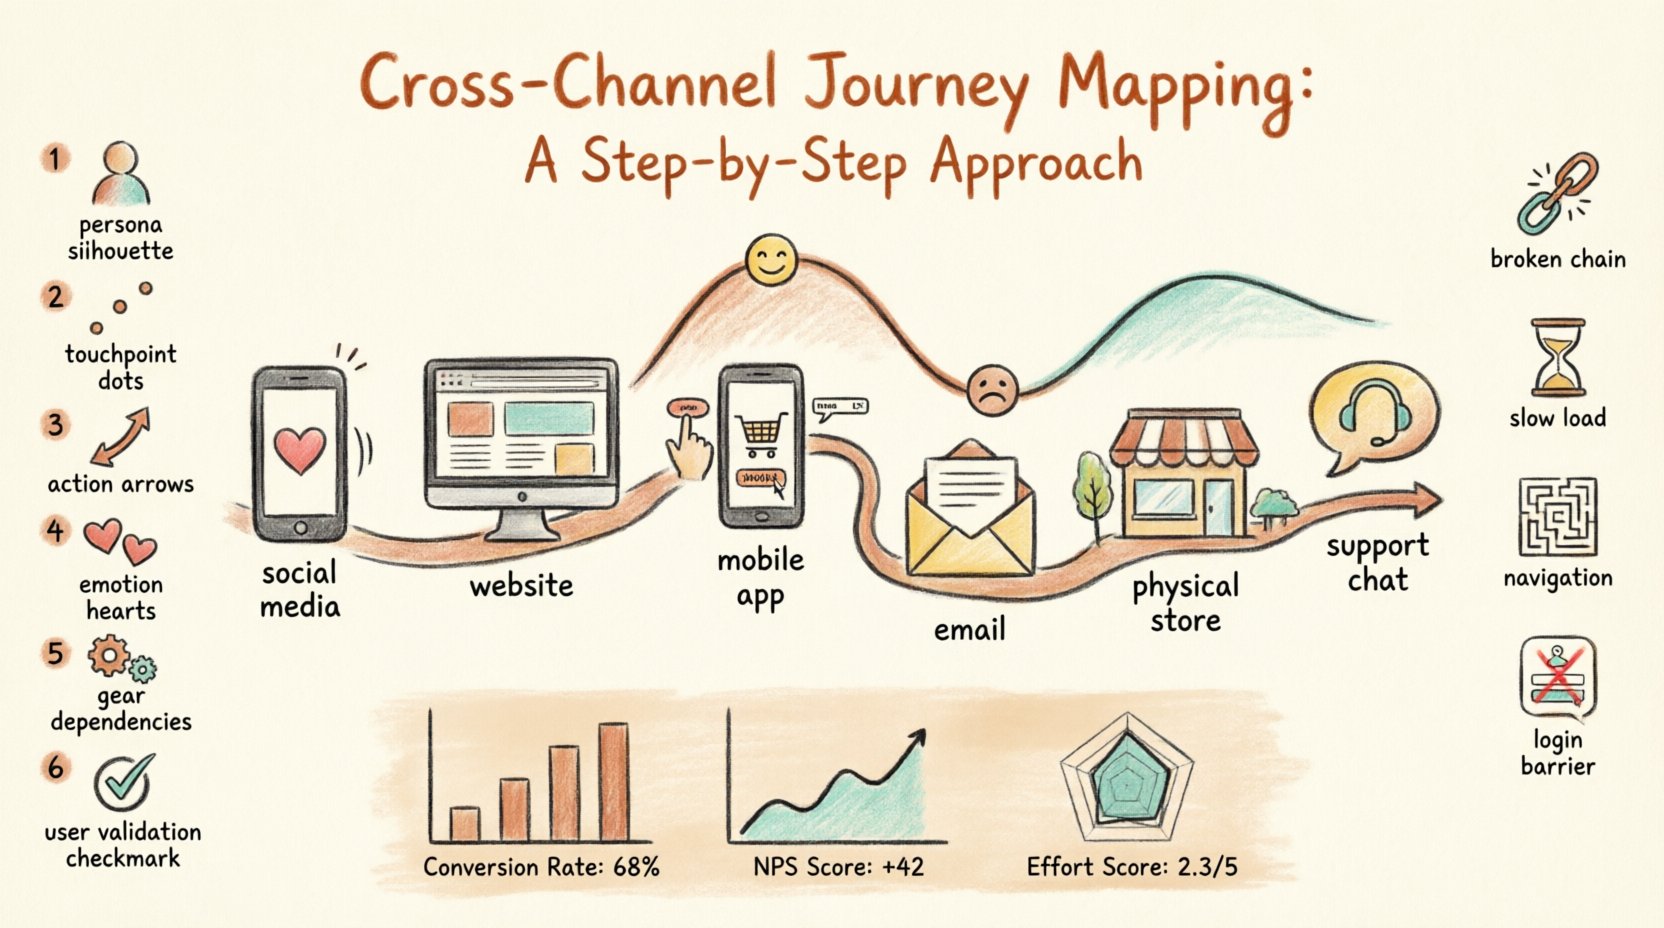
Step 1: Define the Persona
A journey map is not for everyone. It is for a specific type of user. Create a detailed persona based on research. Give them a name, a job title, and motivations. What are their technical skills? What are their pain points? Why do they need your product?
For example, consider a persona named “Alex.” Alex is a busy professional who shops on mobile during commute hours and researches on desktop at home. Alex expects instant answers. If the mobile experience lags, Alex leaves. The map must reflect Alex’s specific behaviors, not generic assumptions.
Step 2: List All Touchpoints
Identify every point of contact between the persona and your brand. Do not limit this to digital interactions. Include physical locations and direct communications.
Common touchpoints include:
- Social media posts
- Email newsletters
- Website landing pages
- Mobile application screens
- In-store signage
- Customer service calls
- Physical receipts
Map these out chronologically. This creates a timeline of the relationship.
Step 3: Chart the User Actions
What does the persona actually do at each touchpoint? Are they clicking, scrolling, reading, or calling? Document the actions required to move from one stage to the next. This reveals the effort required from the user.
High effort indicates friction. If a user must re-enter data on every channel, the process is flawed. Low effort indicates a smooth flow. Aim to reduce the cognitive load on the user throughout the journey.
Step 4: Map Emotional States
Actions tell only half the story. Emotions tell the other half. How does the user feel at each stage? Are they excited, confused, frustrated, or relieved?
Plot these emotions on a curve. A dip in the curve indicates a problem area. A peak indicates a moment of delight. The goal is to smooth out the dips and amplify the peaks. This emotional mapping helps teams empathize with the user experience.
Step 5: Identify Internal Dependencies
Behind every customer action is an internal process. What system handles that request? Which team is responsible for that response? Understanding these dependencies is crucial for fixing issues.
For instance, if a user emails support about a return, but the inventory system is not updated, the refund is delayed. Mapping this link highlights where the process breaks down. It connects the external experience to the internal machinery.
Step 6: Validate with Real Users
Assumptions are dangerous. Take your draft map to actual users. Conduct interviews or usability tests. Ask them to walk through the journey while thinking aloud. Compare their actual experience with your map.
If they mention a step you missed, add it. If they describe an emotion you did not capture, update the curve. Validation ensures the map reflects reality, not theory.
📊 Analyzing Specific Touchpoints
Different channels serve different purposes in the journey. Some are for discovery, some for education, and some for transaction. Understanding the role of each channel prevents misalignment. The table below outlines common channels and their typical functions within a cross-channel context.
| Channel | Primary Function | User Expectation | Potential Friction |
|---|---|---|---|
| Social Media | Awareness & Discovery | Quick, visual content | Misleading ads |
| Website | Information & Research | Fast loading, clear info | Complex navigation |
| Mobile App | Convenience & Transactions | Snapshots, speed, personalization | Login issues, bugs |
| Nurturing & Reminders | Relevant, timely messages | Spam filters, irrelevant content | |
| In-Store | Experience & Fulfillment | Personal interaction, immediate gratification | Stockouts, long queues |
| Support Chat | Problem Resolution | Quick answers, empathy | Bot loops, slow response |
Review this table against your specific business model. Adjust the functions based on your industry. The key is ensuring the transition between these channels is seamless.
🚧 Identifying Friction Points
Once the map is drawn, the analysis begins. Look for areas where the journey stalls. Friction is the enemy of conversion. It occurs when the user encounters unexpected barriers.
Common friction sources include:
- Context Switching: Forcing users to log in again on a new device.
- Inconsistent Messaging: Different offers on different platforms.
- Slow Load Times: Technical delays that break focus.
- Confusing Navigation: Moving too many clicks to reach a goal.
- Broken Handoffs: Losing data when moving from web to mobile.
When you find a friction point, ask “Why?” five times to find the root cause. Is it a technical bug? A policy restriction? A lack of training? Fixing the root cause prevents recurrence.
📈 Measuring Performance
A map is a static document unless you measure its impact. You need Key Performance Indicators (KPIs) to track progress. These metrics should align with the objectives set in the preparation phase.
Relevant metrics include:
- Conversion Rate: Percentage of users completing the journey.
- Time on Task: How long it takes to complete a specific step.
- Net Promoter Score (NPS): Customer loyalty and satisfaction.
- Customer Effort Score (CES): How easy the journey felt.
- Churn Rate: Percentage of users who stop using the service.
Track these metrics over time. Compare the data before and after implementing changes based on the map. This proves the value of the mapping exercise. If metrics do not improve, revisit the map to find new opportunities.
🔄 Keeping the Map Alive
A journey map is not a one-time project. Customer behaviors change. New channels emerge. Technology evolves. A map created today may be obsolete in six months. Treat the map as a living document.
To maintain relevance:
- Update Quarterly: Review the map regularly.
- Monitor Feedback: Watch for new complaints or suggestions.
- Track Trends: Stay aware of industry shifts.
- Involve New Staff: Ensure new team members understand the current model.
Regular updates keep the organization agile. It allows you to adapt to market changes before they become crises. Continuous improvement is the only way to sustain a competitive advantage.
🔍 Common Pitfalls to Avoid
Many teams struggle with this process. Recognizing common mistakes can save time and effort. Avoid the following errors to ensure success.
1. Focusing on Too Many Personas
Do not try to map every single user type at once. Create one map for the primary persona. Create a second map for the secondary persona. Trying to combine them creates a confusing hybrid that satisfies no one.
2. Ignoring Negative Feedback
It is tempting to focus only on the success stories. However, the failures hold the most valuable lessons. Listen to the complaints. They point directly to the broken parts of the journey.
3. Over-Reliance on Assumptions
Do not guess how users behave. Validate everything with data. If you assume a user prefers mobile, but data shows desktop usage is higher, your map is wrong. Trust the evidence.
4. Neglecting Internal Capabilities
Design a journey that the organization cannot deliver. If you promise instant delivery but your logistics take weeks, the map is a lie. Ensure the experience matches operational reality.
5. Stopping After the Sale
The journey does not end at checkout. Post-purchase support, onboarding, and retention are part of the experience. A map that stops at the transaction ignores the long-term relationship.
🤝 Aligning Stakeholders
One of the biggest challenges is getting everyone on board. Different departments have different priorities. Sales wants leads. Support wants fewer tickets. Product wants features.
The journey map acts as a neutral ground. It shows the customer’s perspective, which is the only perspective that matters in the long run. Use the map to facilitate conversations. Show the team where their work impacts the user. This builds empathy and collaboration.
Hold workshops where stakeholders walk through the map together. Ask them to identify where their department fits. This clarifies responsibilities and reduces blame games. When everyone sees the same path, they can work together to clear obstacles.
📝 Summary of Best Practices
To summarize the approach, keep these core principles in mind:
- Start with the User: Always prioritize the customer’s needs over internal efficiency.
- Data Drives Decisions: Use analytics to validate assumptions.
- Keep it Simple: A complex map is hard to use. A simple map is actionable.
- Collaborate Widely: Involve diverse teams in the creation process.
- Iterate Continuously: Treat the map as a draft that improves over time.
Implementing cross-channel journey mapping requires patience and discipline. It is not a quick fix. It is a strategic shift in how you view your business. By focusing on the user’s path across all channels, you build a more resilient and responsive organization. The investment in mapping pays off through better retention, higher efficiency, and stronger customer relationships. Start with the steps outlined here and refine them as you learn more about your audience.

