


Customer journey mapping has become a standard practice across organizations of all sizes. It is often treated as a box-checking exercise, a deliverable for a workshop, or a poster for the breakroom. However, a significant number of these maps fail to influence actual business strategy or improve the customer experience. If your map sits in a shared drive, gathering digital dust, or if the data it presents conflicts with what your frontline staff observe daily, it is time to question its validity.
A journey map is not merely a diagram of touchpoints. It is a strategic tool designed to reveal friction, emotional shifts, and opportunities for improvement. When it misses the mark, the organization loses the ability to see the customer experience through the customer’s eyes. This guide explores the specific reasons why journey maps fail and provides a framework for auditing and realigning your current approach.
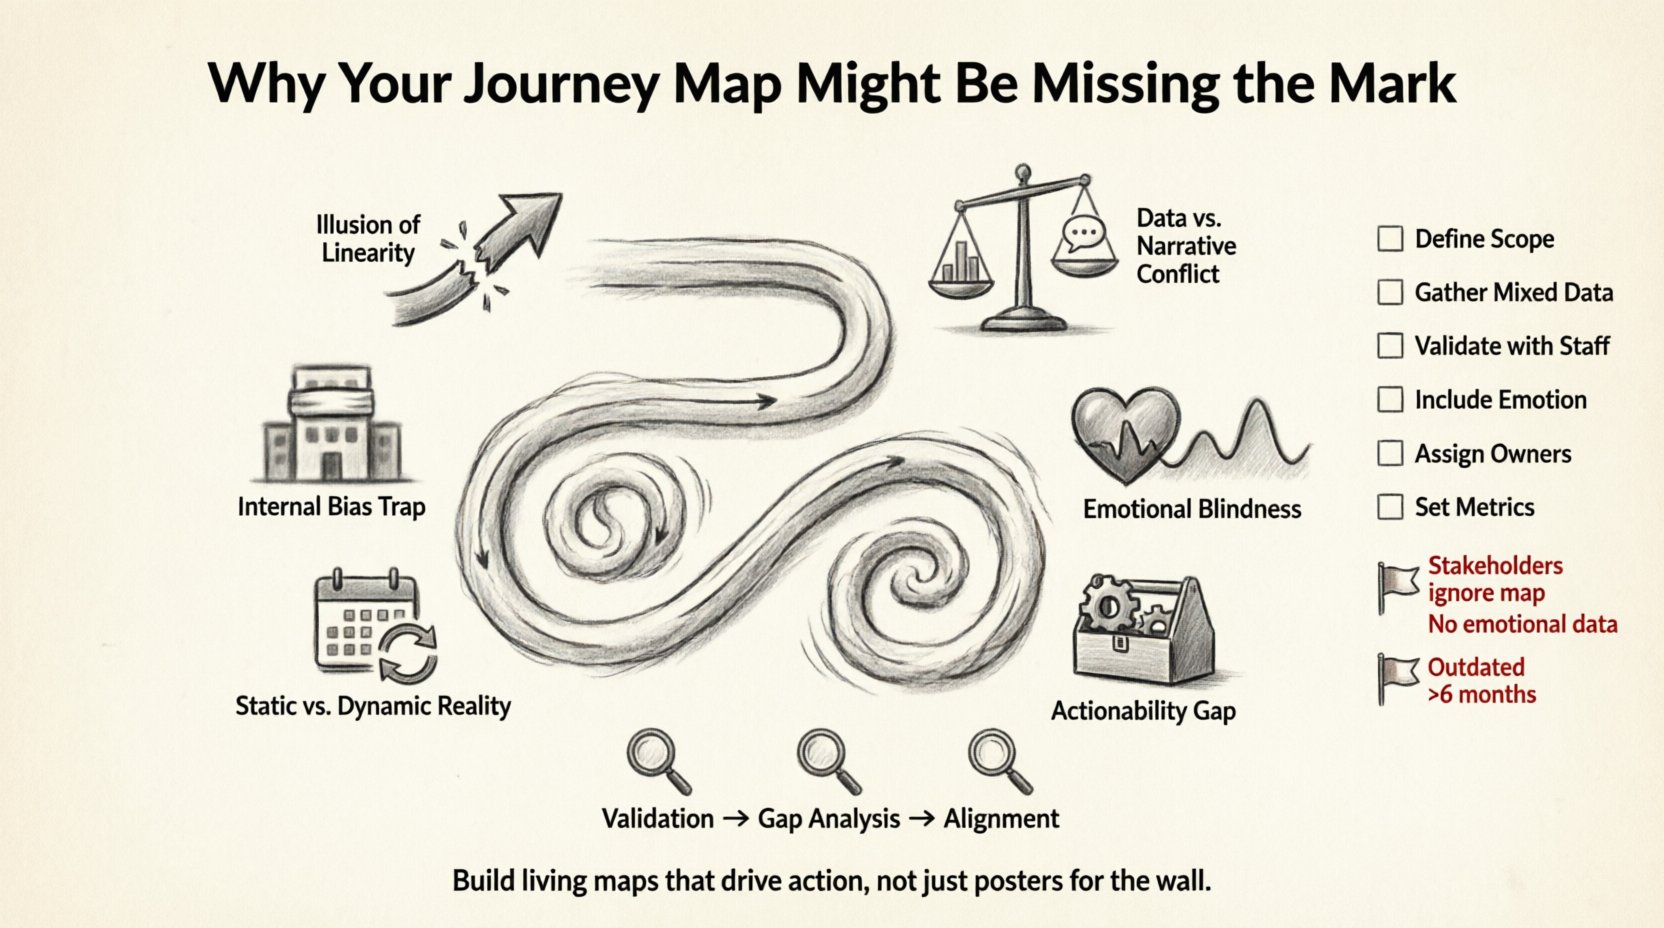
1. The Illusion of Linearity 📉
The most common structural error in journey mapping is the assumption that the customer journey is a straight line. Organizations often visualize the process as a linear progression: Awareness → Consideration → Purchase → Retention. While this works for simple transactions, it rarely reflects the complex, non-linear reality of modern decision-making.
- Real-world behavior: Customers often jump between stages. They might purchase, then contact support, then browse again for a different product, and finally return to the initial brand.
- Channel switching: A user might see an ad on social media, research on a desktop, and complete the purchase on a mobile device hours later.
- External factors: Life events, economic shifts, or competitor actions can reset the journey entirely.
When a map enforces a rigid linear path, it obscures the loops and spirals that actually define the customer experience. This leads to gaps in service where the organization expects the customer to be at stage X, but they have actually moved backward to stage Y due to confusion or friction.
2. The Data vs. Narrative Conflict 📊
A journey map must balance quantitative data with qualitative narrative. Too often, organizations lean too heavily on one side, resulting in a map that is either coldly statistical or purely anecdotal.
Too Much Data, Not Enough Story
When a map is driven solely by analytics, it becomes a heatmap of clicks and drop-off rates. While useful for technical optimization, this approach misses the human element. It tells you what happened, but not why.
Too Much Story, Not Enough Data
Conversely, a map based entirely on workshops and assumptions can become a fantasy. If the emotional states depicted are based on a single interview rather than a broad user study, the map reflects a niche experience rather than the broader population.
The effective approach requires triangulation. You need survey data to validate the volume of issues, interview transcripts to understand the emotional weight, and operational data to understand the feasibility of fixes.
3. The Internal Bias Trap 🏢
One of the most pervasive issues is internal bias. This occurs when the journey is mapped from the perspective of the organization, not the customer. It is often called the “process map” masquerading as a “journey map”.
- Departmental silos: The sales team maps the sales process. The support team maps the support ticket flow. Neither sees the full picture.
- Assumed intent: The organization assumes the customer wants to buy quickly, while the customer might actually want to learn more before committing.
- Blind spots: Internal processes that are invisible to the customer (like backend approvals) are often treated as customer touchpoints, or conversely, critical hidden moments of truth are ignored.
To fix this, you must step outside the organization. Conduct shadowing sessions where team members observe real customer interactions without intervening. This reveals the difference between the intended experience and the actual experience.
4. Emotional Blindness ❤️
A journey map without an emotional curve is just a list of tasks. The emotional state of the customer is the true driver of loyalty and advocacy. If your map lacks a dimension tracking frustration, confusion, delight, or relief, it is missing its most critical value.
Consider the following scenarios where emotion matters:
- High Anxiety: A customer entering a healthcare portal during a medical emergency.
- High Trust: A customer transferring large sums of money to a financial institution.
- Low Friction: A customer reordering a subscription product they love.
Without visualizing these emotional peaks and valleys, you cannot prioritize improvements effectively. A step that is technically simple might cause high anxiety if the language used is confusing. A step that is technically complex might be acceptable if it provides high value or reassurance.
5. Static vs. Dynamic Reality 🔄
Journey maps are often created once and then filed away. However, customer behavior and market conditions are dynamic. A map created six months ago may be obsolete today due to new regulations, technology changes, or shifts in consumer sentiment.
A living journey map requires a governance model. This includes:
- Regular Reviews: Scheduling quarterly or bi-annual reviews to validate the map against current data.
- Trigger Events: Updating the map immediately after major product launches or service disruptions.
- Feedback Loops: Integrating direct customer feedback mechanisms (NPS, CSAT) into the map creation process.
If the map does not evolve, it becomes a historical document rather than a strategic tool. It loses its authority when stakeholders realize the data is outdated.
6. The Actionability Gap 🛠️
Many organizations create beautiful maps that end up in presentations. The failure point here is the lack of clear ownership and action plans. Identifying a pain point is easy; assigning a task to fix it is hard.
For a map to be effective, every identified friction point must be linked to:
- A Metric: How will we measure improvement?
- A Owner: Which department or individual is responsible?
- A Timeline: When will the fix be deployed?
- A Business Case: Why is this worth the investment?
Without these links, the map remains an observation tool rather than an execution tool. It generates insight but fails to drive change.
Common Signs of a Broken Journey Map 🚩
Use the following table to audit your current assets. If you check multiple boxes in the “Indicators” column, your map likely needs significant revision.
| Indicator | What It Means | Severity |
|---|---|---|
| Stakeholders ignore the map in meetings | The map is not relevant to decision-making. | High |
| Frontline staff say it is “not accurate” | Internal bias or lack of field validation. | High |
| No improvement in KPIs since mapping | Lack of actionable insights or ownership. | Medium |
| Linear steps only (A to B to C) | Does not reflect real-world non-linear behavior. | Medium |
| No emotional data included | Missing the human context of the journey. | High |
| Created over a single workshop | Lacks diverse data sources and validation. | Medium |
| Version is outdated by >6 months | Market or product changes have rendered it obsolete. | Medium |
How to Audit Your Current Map 🔍
Before rebuilding, you must assess the current state. This audit process involves three specific phases: Validation, Gap Analysis, and Alignment.
Phase 1: Validation
Take the current map to the front lines. Ask customer service agents, sales representatives, and product managers to walk through the steps. Ask them: “Is this how it actually happens?” “Where do we get stuck?” “Where does the customer get confused?” If the frontline team cannot validate the steps, the map is fiction.
Phase 2: Gap Analysis
Compare the map against actual data logs. If the map says the customer spends 5 minutes on the pricing page, but analytics show 45 minutes, there is a disconnect. Investigate why. Is the pricing confusing? Is the comparison tool missing? This data discrepancy reveals the hidden friction points.
Phase 3: Alignment
Ensure the map aligns with business goals. If the business goal is retention, but the map focuses entirely on acquisition, the map is misaligned. Every stage of the journey should contribute to the overarching organizational objectives.
Building for Reality, Not Ideals 🏗️
Many organizations build a “To-Be” map that represents their ideal world. While this is useful for vision, it is useless for execution if it ignores the “As-Is” reality. You must distinguish between the two.
- As-Is Map: Documents the current reality, including all errors, delays, and customer complaints. This is where you find the problems.
- To-Be Map: Documents the desired future state after improvements are made. This is where you find the opportunities.
Skipping the As-Is map is a common mistake. If you jump straight to the ideal state, you risk solving the wrong problems or implementing solutions that are technically impossible with current resources. The gap between As-Is and To-Be is where the roadmap for improvement lives.
Aligning Cross-Functional Teams 🤝
A journey map is often a cross-functional document, yet it is frequently owned by a single department, usually Marketing or CX. This creates a disconnect. If Support owns the map, Sales ignores it. If Sales owns it, Product ignores it.
To ensure the map drives organization-wide change, you need a governance structure:
- Steering Committee: Leaders from key departments (Sales, Support, Product, Marketing) who review the map quarterly.
- Shared Ownership: Specific touchpoints are assigned to specific department heads who are accountable for the performance of that stage.
- Common Language: Ensure everyone defines terms like “conversion” or “churn” the same way within the context of the map.
When teams feel ownership over specific parts of the journey, they are more likely to invest resources in improving them. The map becomes a shared contract for customer experience quality.
The Role of Technology in Mapping 💻
While no specific software should define your strategy, the tools you use matter for efficiency. Manual mapping on sticky notes or whiteboards is great for workshops but poor for maintenance and sharing.
Effective mapping requires a platform that allows:
- Collaboration: Multiple users editing simultaneously.
- Integration: Connecting map data to ticketing systems or analytics platforms.
- Visualization: Clear rendering of the emotional curve and touchpoints.
- Accessibility: Ensuring the map is viewable by anyone in the organization, not just the CX team.
However, do not let the tool dictate the content. A beautiful digital map that is based on bad assumptions is still a bad map. The tool is secondary to the rigor of the research and the quality of the insights.
Moving Forward: A Checklist for Success ✅
If you are ready to fix your current journey mapping practice, use this checklist to guide your next initiative.
- ☐ Define the Scope: Are you mapping the full customer lifecycle or a specific service interaction?
- ☐ Gather Mixed Data: Combine analytics, interviews, and operational logs.
- ☐ Validate with Staff: Confirm accuracy with frontline employees.
- ☐ Include Emotion: Map the emotional state at every touchpoint.
- ☐ Identify Friction: Highlight specific pain points, not just steps.
- ☐ Assign Owners: Ensure every pain point has a responsible owner.
- ☐ Set Metrics: Define how success will be measured.
- ☐ Schedule Reviews: Plan the next update date.
- ☐ Distribute Widely: Make the map accessible to all stakeholders.
The Cost of Ignoring the Map 📉
Ignoring the signs that your journey map is missing the mark carries a tangible cost. It leads to:
- Wasted Investment: Spending money on features that solve problems that don’t exist.
- Customer Churn: Frustrated customers leave when their friction points are not addressed.
- Employee Frustration: Staff are asked to do things that the process map says are impossible.
- Strategic Drift: Departments work in isolation, moving the company in different directions.
Conversely, a robust, accurate journey map acts as a compass. It aligns resources with customer needs and provides a clear view of where the organization stands relative to its goals. It transforms the customer experience from a vague concept into a manageable set of actionable processes.
The goal is not to create a perfect document. The goal is to create a living understanding of your customer. When your map reflects reality, you can make decisions with confidence. When it reflects fantasy, you are navigating blind.
Take the time to audit your current assets. Challenge the assumptions. Involve the teams on the front lines. And ensure that every step on your map has a corresponding action plan. This is the only way to ensure your journey map serves its purpose: guiding your organization toward a better experience for your customers.

