


Creating a customer journey map often feels like a logistical exercise. Teams draw arrows, define touchpoints, and list steps. However, a map that ignores the human mind is merely a diagram, not a strategic asset. To truly understand the customer journey, we must look beyond the actions and into the cognitive processes driving them. This guide explores the psychology behind the customer journey map, focusing on how emotions, biases, and mental models shape every interaction.
Understanding the Cognitive Landscape 🧭
When a customer engages with a brand, they are not operating as a rational robot. They are navigating a complex web of expectations, fears, and desires. The psychology of the journey map requires us to acknowledge that decision-making is often emotional, with logic serving as a justification for feelings.
Here are the foundational psychological concepts that underpin effective journey mapping:
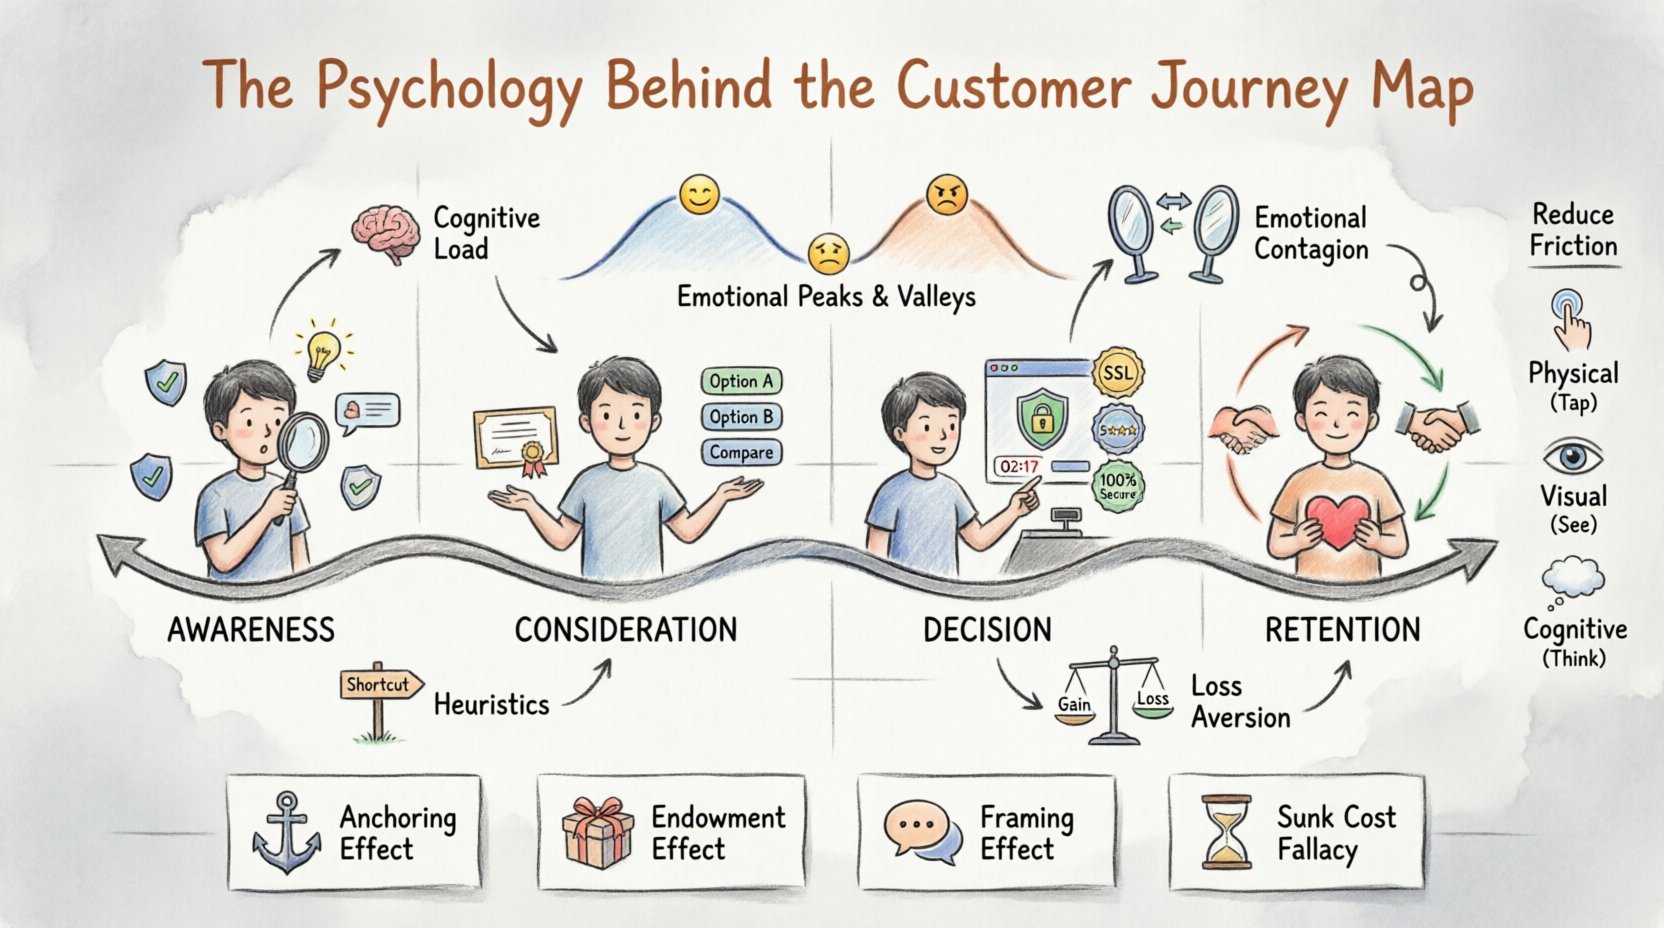
- Cognitive Load: The amount of mental effort required to process information. High cognitive load leads to frustration and abandonment.
- Emotional Contagion: Users often mirror the tone and energy of the interface or service representative.
- Heuristics: Mental shortcuts used to make decisions quickly. These often override detailed analysis.
- Loss Aversion: The fear of losing something (time, money, opportunity) is stronger than the desire to gain something of equal value.
Mapping these elements allows organizations to anticipate friction before it becomes a barrier. A map that only tracks clicks misses the silent struggles happening in the user’s mind.
Emotional States Across Journey Stages 😊😟😠
Every stage of the customer lifecycle triggers a specific psychological response. Understanding these emotional states is critical for designing experiences that resonate.
1. Awareness Stage: Curiosity and Skepticism
At the beginning of the journey, the customer is often curious but guarded. Their brain is scanning for patterns. They ask themselves, “Do I need this?” and “Is this trustworthy?”.
Psychological Drivers:
- Pattern Recognition: The brain seeks familiarity. A confusing layout triggers immediate distrust.
- Social Proof: Seeing others validate the solution reduces perceived risk.
- Attention Economy: The user has limited attention. They will leave if the value proposition is not immediate.
2. Consideration Stage: Analysis and Comparison
Here, the customer shifts from curiosity to evaluation. They are comparing options, often weighing pros and cons. This is where confirmation bias often kicks in.
Psychological Drivers:
- Confirmation Bias: Users tend to favor information that confirms their initial preference.
- Choice Overload: Too many options can lead to decision paralysis. Simplifying choices improves conversion.
- Authority: Expert opinions and certifications carry significant weight during this phase.
3. Decision Stage: Risk and Trust
The moment of purchase is fraught with anxiety. Even when a customer wants to buy, the fear of making a mistake can halt progress. This is the peak of loss aversion.
Psychological Drivers:
- Friction Reduction: Every extra click increases the perceived risk.
- Security Cues: Visual indicators of safety (locks, guarantees) alleviate fear.
- Urgency: Scarcity triggers a fear of missing out, pushing the decision forward.
4. Retention Stage: Habit and Satisfaction
Post-purchase, the psychological focus shifts to validation and habit formation. Did they make the right choice? Can they integrate this into their routine?
Psychological Drivers:
- Cognitive Dissonance: Users may doubt their choice if the experience is not seamless. Reassurance is key.
- Dopamine Loops: Small wins and positive feedback reinforce usage.
- Reciprocity: Feeling valued encourages continued loyalty.
Cognitive Biases That Influence Behavior 🧠
Biases are not flaws; they are features of human cognition. A journey map that accounts for these biases can guide users more effectively.
| Biase | Definition | Impact on Journey | Mitigation Strategy |
|---|---|---|---|
| Anchoring Effect | Relying too heavily on the first piece of information offered. | Users judge value based on the first price or feature they see. | Present the best value option first or frame comparisons clearly. |
| Endowment Effect | Valuing something more highly simply because you own it. | Users hesitate to cancel subscriptions because they feel ownership. | Make cancellation easy but use reminders to ensure they still want the service. |
| Framing Effect | Decisions are influenced by how information is presented. | “90% Success Rate” sounds better than “10% Failure Rate”. | Frame benefits positively without being misleading. |
| Sunk Cost Fallacy | Continuing a behavior because of previously invested resources. | Users stay in a process because they already spent time setting it up. | Minimize initial setup time to prevent dropout before value is delivered. |
The Role of Trust and Social Proof 🤝
Trust is the currency of the customer journey. Without it, no transaction occurs. Psychologically, trust is built through consistency, transparency, and validation from peers.
When mapping the journey, consider where the customer feels vulnerable. These are the moments where trust must be explicitly reinforced. For example, during data entry, users feel exposed. Providing clear privacy policies and security badges at this specific touchpoint reduces anxiety.
Social proof acts as a shortcut for trust. When a user sees that others like them have had success, their own perceived risk decreases. This is why testimonials, case studies, and user-generated content are powerful psychological tools. They signal safety and belonging.
Friction and Cognitive Load 🚧
Friction is not always bad. Sometimes, a little friction slows a user down to ensure they are thinking carefully. However, unnecessary friction creates cognitive load that leads to abandonment.
Types of Friction:
- Physical: Hard to click, type, or navigate.
- Visual: Cluttered design, confusing icons, or poor contrast.
- Cognitive: Complex terminology, unclear instructions, or too many choices.
To reduce cognitive load, apply the principle of progressive disclosure. Show only what is necessary at the current moment. Save complex details for later. This keeps the user’s mental energy focused on the immediate task without overwhelming them.
Mapping Emotions: The Emotional Journey Map 📈
A standard journey map tracks actions. An emotional journey map tracks feelings. These two often diverge. A user might click a button (action) but feel confused (emotion).
Steps to Map Emotions:
- Identify Touchpoints: List every interaction.
- Gather Data: Use surveys, interviews, and session recordings.
- Plot Sentiment: Mark highs and lows on a graph.
- Analyze Causes: Why did the sentiment drop? Was it a broken link, a rude message, or a slow load time?
- Design Interventions: Create solutions to smooth the dips.
This approach reveals the “hidden” journey. A customer might successfully complete a purchase but feel anxious about delivery. Addressing this anxiety in the confirmation email can turn a transaction into a relationship.
Common Pitfalls in Journey Mapping 🚫
Even with psychological insights, teams often stumble. Recognizing these pitfalls helps maintain accuracy.
- Assuming Rationality: Believing users always act logically leads to poor design. Users are emotional beings.
- Ignoring Context: A user’s state of mind changes based on time, device, and environment. A mobile user is often in a hurry, while a desktop user might be researching.
- One-Size-Fits-All: Assuming all customers have the same journey. Segmentation is essential for psychological accuracy.
- Static Maps: Human psychology evolves. A map created today may not reflect behaviors next year. Regular updates are necessary.
Building Resilience Through Empathy 💡
The ultimate goal of understanding the psychology behind the customer journey map is to build resilience. When a brand understands the human mind, it can anticipate problems before they happen. This is not about manipulating users; it is about removing barriers so they can achieve their goals effortlessly.
Key Takeaways for Implementation:
- Focus on the emotional experience, not just the functional steps.
- Use data to validate assumptions about user behavior.
- Test changes to see how they affect cognitive load and trust.
- Keep the map alive by updating it with new psychological insights.
Conclusion: A Human-Centric Approach 🏁
A journey map is more than a visual tool; it is a narrative of human behavior. By integrating psychology into the mapping process, organizations create experiences that feel intuitive, supportive, and trustworthy. This shift from process-centric to people-centric thinking is what transforms a standard customer interaction into a meaningful connection.
As you review your own journey maps, ask yourself: Are we mapping the clicks, or are we mapping the mind? The answer will determine the quality of the experience you deliver. Prioritize understanding, respect the cognitive limits of your users, and design for their emotional well-being. This is the foundation of lasting success.

