


System architecture relies heavily on clear communication. While code defines behavior, diagrams define understanding. Among the various modeling techniques available, the Interaction Overview Diagram (IOD) serves a specific and critical role in visualizing the flow of control between different components or services. Unlike a sequence diagram that details the step-by-step message exchange between objects, an IOD provides a high-level view of the logic flow, branching, and decision points across the system.
Creating an effective diagram is only half the battle. The other half lies in ensuring that the diagram remains readable over time and can be maintained without causing confusion. As systems evolve, diagrams often become outdated artifacts that mislead rather than inform. This guide outlines the essential strategies for constructing interaction overview diagrams that stand the test of time.
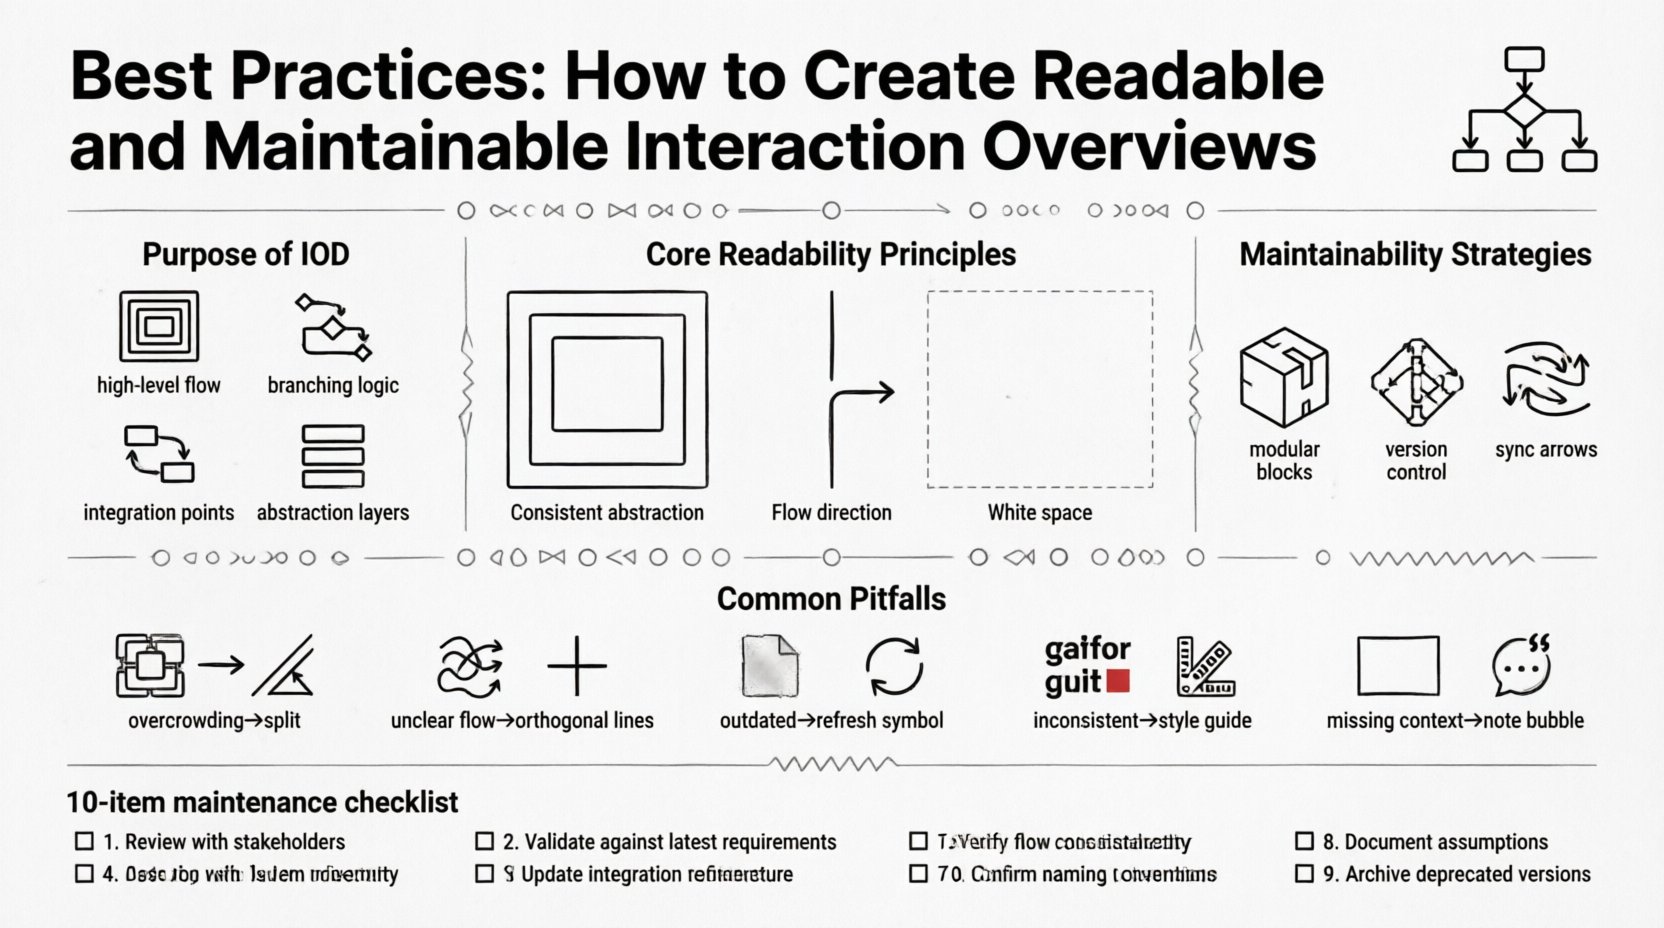
🎯 Understanding the Purpose of an Interaction Overview Diagram
Before diving into design principles, it is vital to understand when and why to use an IOD. These diagrams are most effective when a system involves complex logic that cannot be easily explained through a linear sequence.
- High-Level Flow: They show how different activities or use cases connect.
- Logic Branching: They illustrate decision points (if/else) and loops.
- Integration Points: They highlight where external services or internal modules interact.
- Abstraction: They allow architects to hide low-level details while preserving the control flow.
When used correctly, an IOD acts as a map for the system’s behavior. When misused, it becomes a wall of text and arrows that no one wants to read.
🛠️ Core Principles for Readability
Readability is not just about aesthetics; it is about cognitive load. A reader should be able to grasp the system’s logic within minutes, not hours. To achieve this, adhere to the following principles.
1. Maintain Consistent Abstraction Levels
One of the most common errors is mixing granularities. Do not combine high-level business processes with low-level API calls in the same frame. If a node represents a “User Login” process, the details of how the password is hashed should be in a separate activity diagram, not inside the IOD node itself.
- Group Related Activities: Use frames or partitions to group logical units.
- Use Standard Symbols: Ensure that decision diamonds and activity circles follow standard conventions.
- Avoid Micro-Managing: If a step requires more than one page to explain, it likely belongs in a different diagram.
2. Optimize Flow Direction
Human eyes naturally read from top to bottom and left to right. Align your primary flow of control with this natural reading pattern.
- Vertical Flow: Prefer vertical arrangements for the main sequence of events.
- Horizontal Flow: Use horizontal arrangements for parallel processes or distinct subsystems.
- Minimize Cross-Links: Avoid arrows that cross the diagram excessively. This creates a “spaghetti” effect that is difficult to trace.
3. Leverage White Space
Clutter is the enemy of comprehension. Do not be afraid to leave empty space. White space separates distinct logical blocks and prevents the diagram from feeling overwhelming.
- Padding: Ensure adequate padding around nodes and connectors.
- Spacing: Separate decision points clearly from the activities they govern.
- Alignment: Use grid lines or alignment tools to keep the layout organized.
📐 Structural Standards and Layout
A consistent structure allows team members to navigate your diagrams without needing a legend every time. Standardization reduces the time required to understand new documentation.
1. Naming Conventions
Every node, frame, and connector must have a descriptive name. Vague labels like “Process 1” or “Action” are insufficient.
- Verb-Noun Format: Use active voice. For example, “Validate User Input” is better than “Input Validation”.
- Consistent Terminology: If you use “Fetch Data” in one part of the diagram, do not use “Retrieve Data” in another. Stick to the system’s domain language.
- Contextual Labels: If a connector represents a specific data payload, label the line with the data type or name.
2. Visual Hierarchy
Visual cues help the reader prioritize information. Not all elements carry the same weight.
- Start and End Nodes: Use distinct shapes or colors to mark the entry and exit points of the flow.
- Decision Points: Ensure decision diamonds are clearly visible and labeled with the condition (e.g., “Is Valid?”).
- Sub-Processes: Use nested frames or distinct backgrounds to indicate that a node expands into a separate diagram.
🔄 Strategies for Maintainability
A diagram that cannot be updated is a liability. Systems change, and documentation must change with them. Maintainability involves both the ease of editing the diagram and the longevity of the information it contains.
1. Modularization
Break large systems into manageable chunks. Do not attempt to model the entire backend of a microservices architecture in a single IOD. Instead, create a top-level overview and link it to detailed diagrams for specific services.
- Top-Level Overview: Shows the main entry points and major subsystems.
- Service-Level Details: Shows the internal logic of a specific service.
- Linkage: Use notes or reference tags to link between overview and detail levels.
2. Version Control
Diagrams should be treated as code. They must reside in a version control system alongside the application code. This ensures that diagram changes are tracked, reviewed, and reversible.
- Commit Messages: Document why a change was made, not just what changed.
- Branching: Create branches for experimental changes before merging into the main documentation.
- Audit Trail: Use the version history to understand the evolution of the system design.
3. Synchronization with Code
The biggest risk to a diagram is that it diverges from the implementation. While perfect synchronization is impossible, regular audits can mitigate this.
- Integration with CI/CD: Set up checks that alert when code structure changes significantly from the documented flow.
- Documentation Driven Development: Update the diagram as part of the definition of done for a feature.
- Regular Reviews: Schedule quarterly reviews to ensure diagrams match current deployments.
📊 Common Pitfalls and Solutions
Even experienced architects fall into traps that degrade diagram quality. Understanding these common pitfalls helps in avoiding them.
| Pitfall | Impact | Solution |
|---|---|---|
| Overcrowding | Readers miss key information due to visual noise. | Split the diagram into smaller, focused views. |
| Unclear Flow | It is impossible to trace the path from start to finish. | Use orthogonal routing and limit arrow crossings. |
| Outdated Content | Developers follow incorrect instructions. | Link diagrams to version control and review regularly. |
| Inconsistent Symbols | Confusion about what a shape represents. | Adopt a standard style guide for all diagrams. |
| Missing Context | Readers do not understand the triggers for the flow. | Add a preamble or note describing the scenario. |
🤝 Collaboration and Review Processes
Diagrams are often created in isolation, but they are meant for a team. Incorporating feedback ensures that the final output serves the entire group.
1. Peer Reviews
Just as code requires a pull request review, diagrams should undergo a similar process. This ensures that the logic holds up under scrutiny.
- Walkthroughs: Have a colleague trace the flow with you to identify gaps.
- Clarity Checks: Ask someone unfamiliar with the project to read the diagram. If they struggle, simplify.
- Completeness: Verify that error handling and edge cases are documented.
2. Accessibility Considerations
Ensure that your diagrams are accessible to all team members, including those using assistive technologies.
- Text Alternatives: Provide alt text or descriptions for diagrams stored in digital repositories.
- Color Usage: Do not rely solely on color to convey meaning. Use shapes or line styles as well.
- Resolution: Ensure diagrams render clearly at different zoom levels and screen sizes.
📋 Maintenance Checklist
Use this checklist to validate your Interaction Overview Diagrams before publishing them to the central documentation hub.
- ☐ Flow Validity: Does the path from start to end make logical sense?
- ☐ Terminology: Are terms consistent with the domain language?
- ☐ Labels: Are all nodes and connectors clearly labeled?
- ☐ Layout: Is the flow primarily top-to-bottom or left-to-right?
- ☐ Dependencies: Are external dependencies clearly marked?
- ☐ Version: Is the diagram version number or date up to date?
- ☐ References: Are links to detailed diagrams included where necessary?
- ☐ Clarity: Is the white space sufficient to prevent clutter?
- ☐ Consistency: Does this diagram match the style of others in the repository?
- ☐ Review: Has a peer reviewed the logic and structure?
🔗 Integration with Technical Documentation
An Interaction Overview Diagram does not exist in a vacuum. It is part of a larger ecosystem of technical documentation.
1. Linking to Specifications
Every major node in the diagram should ideally link to a specific specification or API documentation. This allows developers to drill down from the visual flow to the technical details without searching through multiple folders.
- Hyperlinks: Embed links directly in the diagram nodes if the tool supports it.
- Reference IDs: Use unique IDs for each node and reference them in the accompanying text.
- Context Notes: Add notes to the diagram that explain the business rules behind specific flows.
2. Living Documentation
Treat the diagram as a living document. It should evolve as the system evolves. Static diagrams become obsolete quickly.
- Change Logs: Maintain a log of changes associated with the diagram file.
- Feedback Channels: Provide a way for readers to flag outdated or confusing parts of the diagram.
- Automation: Where possible, generate diagrams from code or configuration to reduce manual maintenance overhead.
🚀 Future-Proofing Your Diagrams
Technology stacks change. Tools change. The logic of the diagram should remain robust despite these shifts.
1. Tool Agnosticism
Avoid locking yourself into a proprietary format that might become obsolete. Use open standards or formats that can be exported to other tools.
- Standard Formats: Prefer formats like XML or JSON-based diagram definitions that are widely supported.
- Export Options: Ensure you can export to PDF, PNG, and SVG for sharing.
- Source Control: Keep the source files in version control, not just the rendered images.
2. Scalability of Structure
Design your diagrams with future growth in mind. A system today might require ten times the functionality tomorrow.
- Expandable Nodes: Design nodes that can be expanded without breaking the overall layout.
- Modular Design: Keep components decoupled so that changes in one area do not require redrawing the whole diagram.
- Flexible Naming: Avoid hard-coding specific service names that might change; use functional names instead (e.g., “Payment Handler” instead of “Stripe Service”).
💡 Conclusion on Best Practices
Creating readable and maintainable interaction overview diagrams requires discipline, consistency, and a focus on the audience. By adhering to structural standards, managing version control rigorously, and prioritizing clarity over complexity, you ensure that your diagrams remain valuable assets throughout the lifecycle of the software.
Remember that the goal is not to create a perfect picture immediately, but to create a system for documentation that allows for continuous improvement. A well-maintained diagram is a signal of a well-maintained system.

