


Creating a clear visual representation of system behavior is essential for any software development lifecycle. One specific tool in the UML toolkit often gets overlooked in favor of Sequence or Activity diagrams: the Interaction Overview Diagram (IOD). This guide provides a structured approach to designing these diagrams effectively, ensuring your documentation is both accurate and readable. We will explore the core components, workflow, and best practices required to build a functional model without relying on specific commercial tools.
📚 What Is an Interaction Overview Diagram?
An Interaction Overview Diagram is a type of UML diagram that describes the control flow of a system. It combines the structural elements of an Activity Diagram with the dynamic interactions of Sequence or Communication Diagrams. Unlike a standard Sequence Diagram, which focuses on the timeline of messages between objects, an IOD focuses on the logic and decision points that determine which sequence occurs next.
Think of this diagram as a high-level map. It shows the major steps in a process, where branching logic occurs, and how different interactions fit together. It is particularly useful when a single sequence is too complex or when multiple scenarios need to be displayed within a single view.
🔍 Why Use This Diagram Type?
Understanding when to deploy an Interaction Overview Diagram is key to efficient modeling. There are specific scenarios where this diagram provides more value than others:
- Complex Control Flow: When a process involves multiple branches, loops, or conditional logic, an IOD clarifies the path taken.
- High-Level Overview: It allows stakeholders to see the “big picture” without getting bogged down in every single message exchange.
- Integration of Interactions: It connects multiple Sequence Diagrams into a cohesive workflow.
- Algorithm Representation: It is excellent for depicting algorithms where the sequence of operations depends on runtime conditions.
🧩 Key Components and Symbols
To draw an effective diagram, you must understand the standard notation used to represent actions and flows. Below is a breakdown of the primary elements you will encounter.
| Symbol | Visual Description | Purpose |
|---|---|---|
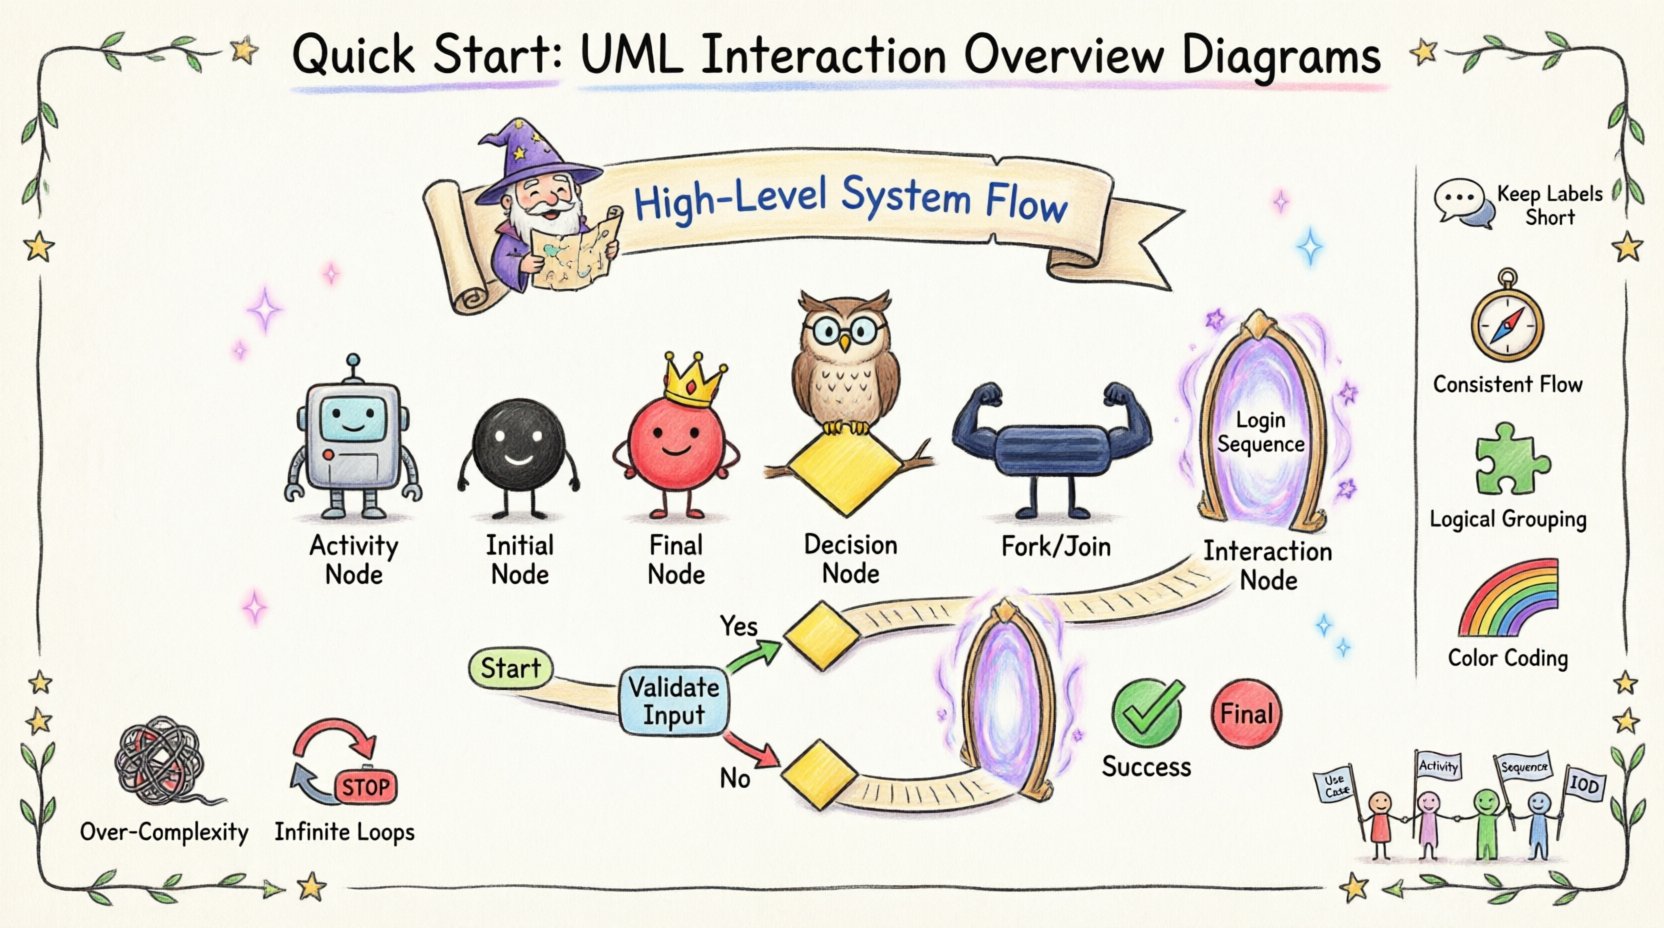
| 🔲 | Rectangle with rounded corners | Activity Node: Represents a step in the process, such as a method call or a decision. |
| ⚫ | Filled Black Circle | Initial Node: The starting point of the flow. |
| 🟡 | Filled Black Circle with Red Border | Final Node: The end of the flow. |
| ⚖️ | Yellow Diamond | Decision Node: Represents a point where the flow splits based on a condition (e.g., Yes/No). |
| ➕ | Thick Black Bar | Fork/Join Node: Splits one flow into multiple concurrent flows or merges multiple flows into one. |
| 🔗 | Small Circle with Text | Interaction Node: Links to a specific Sequence or Communication Diagram. |
📋 Preparing Your Model
Before opening your modeling environment, preparation is critical. A well-structured diagram starts with a clear understanding of the requirements. Follow these preparatory steps to ensure your diagram is grounded in reality.
- Define the Scope: Determine the specific functionality you are modeling. Are you covering the entire login process, or just the password reset flow?
- Identify Actors: List all users or external systems that interact with the process. This helps in labeling the interaction nodes correctly.
- Map the Logic: Draft a text-based flow or pseudocode first. Write down the “If This, Then That” logic.
- Gather Sequence Details: If you are referencing existing Sequence Diagrams, ensure they are finalized. The IOD will act as the container for these detailed views.
🛠️ Step-by-Step Construction Guide
Once you have your requirements and logic mapped, you are ready to draw. Follow this sequence to build a robust Interaction Overview Diagram.
1. Set the Canvas
Start by defining the boundaries of your diagram. Ensure there is enough space for branches. A cramped diagram is difficult to read and maintain. Leave margins around the edges for potential future additions.
2. Place the Initial Node
Begin at the top or left side of the canvas. Place the Initial Node (filled black circle). This indicates where the process begins. Ensure there is a clear label nearby indicating the trigger for this process, such as “User Request” or “System Event”.
3. Draw the First Activity
Connect the Initial Node to the first action using a control flow arrow. The first action is often an input validation or a database query. Represent this as a rounded rectangle. Label it clearly, such as “Validate Credentials”.
4. Insert Decision Points
When the process reaches a condition, insert a Decision Node (yellow diamond). Connect this node to the previous activity. From the diamond, draw arrows for each possible outcome. Label these arrows with the condition, such as “Valid” or “Invalid”.
5. Link to Interaction Nodes
For complex steps, do not draw every message. Instead, use an Interaction Node. This is a small circle or box that references a separate Sequence Diagram. This keeps the overview clean. Label the node with the name of the referenced sequence, like “Login Sequence”.
6. Handle Concurrency
If multiple actions happen simultaneously, use a Fork Node (thick black bar). Split the flow into parallel branches. Later, use a Join Node to merge them back into a single flow once all parallel tasks are complete. This indicates that the system waits for all branches to finish before proceeding.
7. Define the Final Node
Every path should logically lead to an end. Place the Final Node (black circle with red border) at the conclusion of the main flow. Ensure that error paths also terminate at a final node or loop back to a decision point.
🔐 Example Scenario: User Authentication
To illustrate these concepts, consider a standard User Authentication process. This scenario demonstrates how the IOD handles success and failure paths.
- Start: User enters credentials.
- Action: System validates input format.
- Decision: Is input valid?
- No: Display error message, return to start.
- Yes: Query database for user record.
- Interaction Node: “Verify Password Sequence”.
- Decision: Is password correct?
- No: Log attempt, display “Invalid Password”.
- Yes: Generate session token.
- Action: Redirect to dashboard.
- End: User logged in.
In this example, the IOD does not show every packet sent between the client and server. Instead, it shows the logical steps. The detailed message exchange is contained within the “Verify Password Sequence” interaction node. This separation of concerns allows the IOD to remain readable while still referencing detailed interactions.
✅ Best Practices for Clarity
A diagram is useless if no one understands it. Adhering to established conventions ensures your documentation remains professional and accessible.
- Keep Labels Concise: Avoid long sentences in node labels. Use verbs and nouns, such as “Submit Form” rather than “The user submits the form to the system”.
- Consistent Flow Direction: Flow should generally move from top to bottom or left to right. Avoid arrows crossing each other excessively.
- Logical Grouping: Use swimlanes if your tool supports them to distinguish between different actors or system components.
- Color Coding: If your environment allows, use color to differentiate between success paths (green) and error paths (red). However, rely on shape and text first for accessibility.
- Minimal Cross-References: Limit the number of external references. If you reference too many Sequence Diagrams, the overview loses its purpose.
- Clear Decision Labels: Every arrow leaving a Decision Node must have a label indicating the condition. Never leave a branch unlabeled.
⚠️ Common Pitfalls to Avoid
Even experienced modelers can make mistakes. Be aware of these common issues that degrade the quality of your diagram.
1. Unreachable Paths
Ensure every branch leads somewhere. Dead ends where no arrow exits indicate a logic error in your design. Every decision point must account for all possible outcomes.
2. Infinite Loops
While loops are valid, ensure there is a mechanism to break out of them. A flow that circles endlessly without a termination condition will confuse readers and suggest a system hang.
3. Over-Complexity
If the diagram becomes too crowded, it is time to split it. Do not try to force an entire system into one page. It is better to have three focused Interaction Overview Diagrams than one massive, unreadable chart.
4. Mixing Paradigms
Do not mix Activity Diagram notation with Sequence Diagram notation in a confusing way. Use Interaction Nodes to reference Sequence Diagrams. Do not draw object lifelines directly on the IOD canvas unless you are creating a specific hybrid view.
5. Ignoring Error Handling
Positive paths are easy to map. Negative paths are often forgotten. Ensure that timeout scenarios, network failures, and permission denials have their own branches and termination points.
🔄 Integrating with Other UML Diagrams
An Interaction Overview Diagram does not exist in isolation. It is part of a larger ecosystem of UML models.
Relationship with Use Case Diagrams
Use Case Diagrams define the “what” of the system. The IOD often details the “how” of a specific Use Case. You can link an IOD to a specific Use Case to show the internal logic of that feature.
Relationship with Activity Diagrams
Activity Diagrams focus on the flow of data and actions. IODs focus on the flow of interactions between objects. The IOD can be seen as a specialized version of the Activity Diagram where the nodes are interaction fragments rather than simple actions.
Relationship with Sequence Diagrams
This is the most direct relationship. The IOD orchestrates the Sequence Diagrams. When you need to explain a complex process, create an IOD that references the Sequence Diagrams for the detailed message exchanges.
🔄 Maintenance and Updates
Software evolves, and so must your diagrams. A static diagram becomes technical debt quickly. Here is how to keep your Interaction Overview Diagrams relevant.
- Version Control: Store your diagram files in a version control system alongside your code. This allows you to track changes over time.
- Code Reviews: Include diagram reviews in your code review process. If the code logic changes, the diagram must be updated to match.
- Refactoring: If you refactor a process, break it down into smaller IODs if necessary. Complexity grows with code; the diagrams must adapt to manage that complexity.
- Documentation Links: Ensure the links between the IOD and the referenced Sequence Diagrams are valid. Broken links reduce trust in the documentation.
🛠️ Tooling Considerations
While this guide does not recommend specific products, the choice of modeling tool can impact your workflow. Look for tools that support:
- Drag-and-Drop Interfaces: For rapid construction of nodes and connectors.
- Link Management: The ability to easily link to external diagrams without manual path editing.
- Export Capabilities: The ability to export the diagram to PNG, SVG, or PDF for inclusion in reports.
- Validation: Some tools can check for common modeling errors, such as dangling arrows or missing labels.
📝 Summary of Workflow
Recap of the essential steps to ensure you are ready to start:
- Define the scope and actors involved.
- Map the logical flow using pseudocode or text.
- Identify where Sequence Diagrams can be referenced.
- Draw the Initial and Final nodes.
- Add Activity Nodes for actions.
- Insert Decision Nodes for logic branches.
- Connect everything with clear control flows.
- Review for clarity, completeness, and consistency.
By following this structured approach, you can create Interaction Overview Diagrams that serve as reliable documentation for your development team. These diagrams bridge the gap between high-level requirements and low-level implementation details, providing a necessary layer of understanding for complex systems.

