
Mastering UML Sequence Diagrams with VPasCode: A Step-by-Step Guide to Modeling Online Order Flows
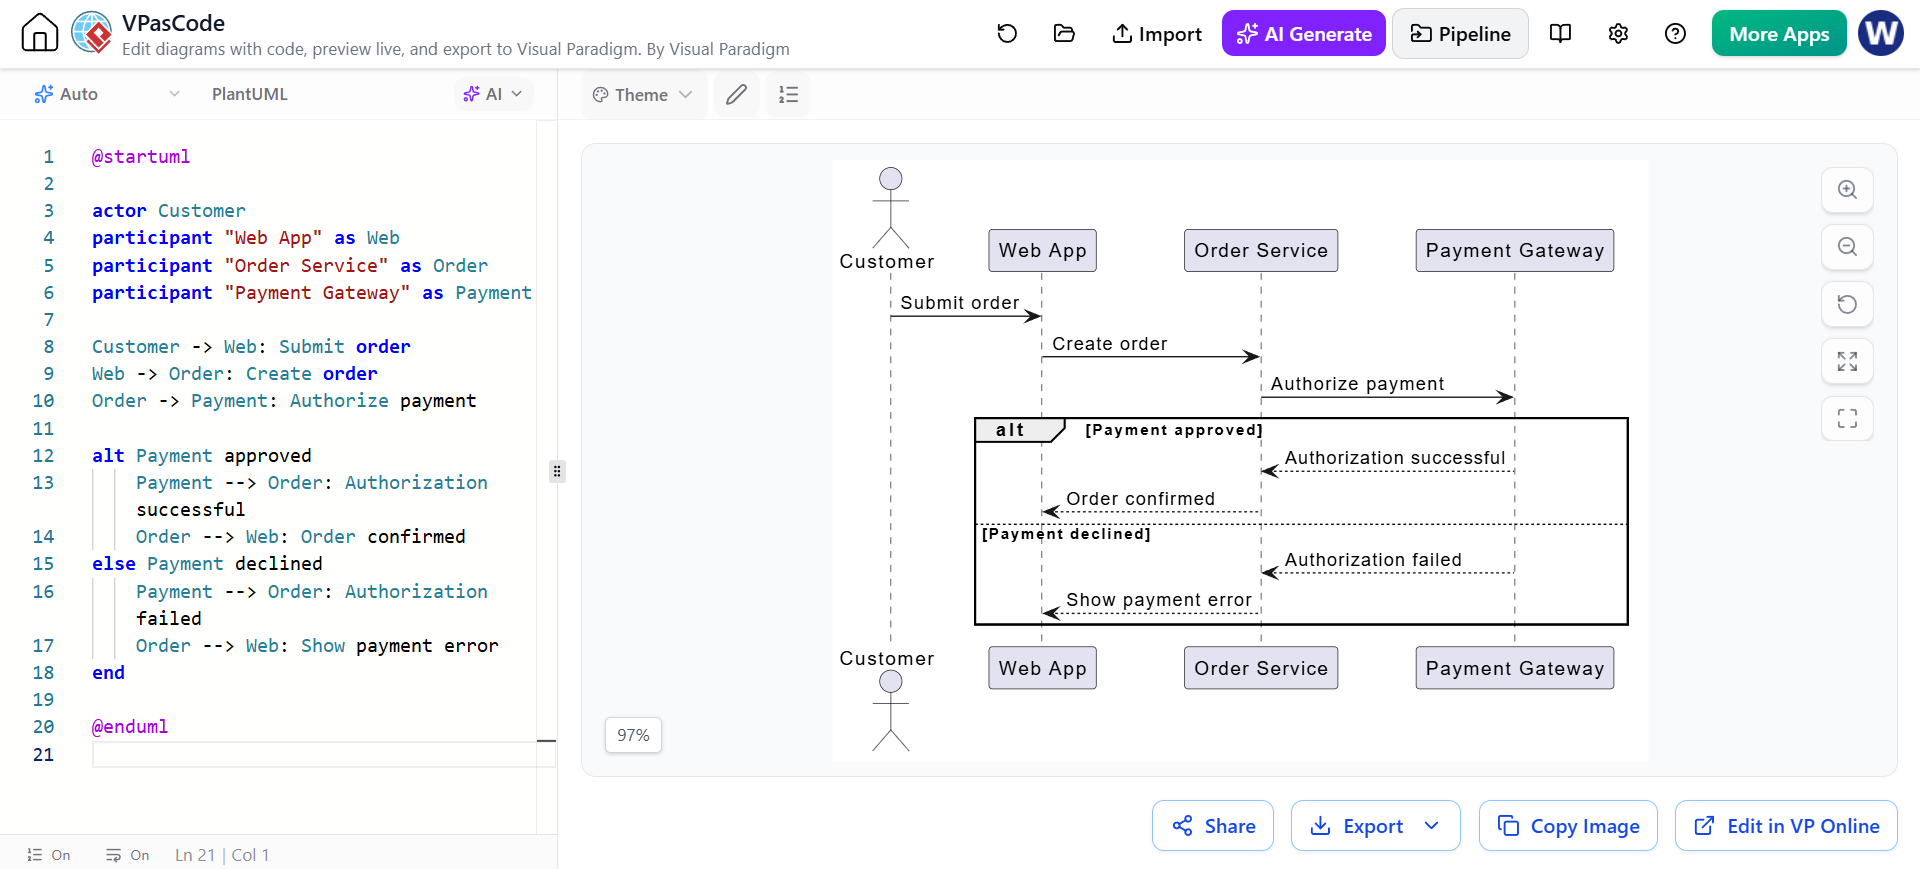
Understanding how different components of a software system interact over time is crucial for building robust applications. In software engineering, the Sequence Diagram is the standard tool used to visualize this time-ordered interaction. Unlike static diagrams that show structure, sequence diagrams tell a story, mapping out the specific messages exchanged between actors and objects.
This tutorial explores how to model a critical business process—an online order submission—using VPasCode, a powerful “Diagram-as-Code” tool. By writing code instead of dragging and dropping shapes, you gain precise control over logic, conditional branching, and system architecture.
Understanding the Components of a Sequence Diagram
Before writing any code, it is essential to understand the vocabulary of UML sequence diagrams. Based on the example shown in the screenshot, the diagram consists of four distinct layers of interaction:
- Actors (The Initiators): Represented by stick figures (e.g., the
Customer), these are human users or external systems that trigger the process. - Participants (The Services): Represented by rectangles (e.g.,
Web App,Order Service,Payment Gateway), these are the logical components or microservices handling the logic. - Activation Bars: The thin rectangles on the vertical lifelines. They indicate when an object is performing an action and is actively waiting for a response.
- Lifelines: The dashed vertical lines extending from participants, representing the existence of the object over time.
Step-by-Step: Modeling the Online Order Process
Let’s walk through the code logic to build the diagram shown in the image. The process is divided into three phases: Setup, The Initial Request, and Conditional Logic.
Phase 1: Defining the System Actors
The first step in VPasCode is to declare the participants. You use the actor keyword for humans and participant for system modules. VPasCode allows you to define aliases (the as keyword) to keep the code concise while keeping the diagram labels clear.
@startuml
actor Customer
participant "Web App" as Web
participant "Order Service" as Order
participant "Payment Gateway" as Payment
@enduml
Phase 2: The Synchronous Flow
Once the actors are defined, we map the linear flow of events. In sequence diagrams, a solid arrow pointing right indicates a synchronous message (a request that waits for a response). The syntax follows the pattern Sender -> Receiver: MessageName.
In our order process, the flow is straightforward:
Customer -> Web: Submit order
Web -> Order: Create order
Order -> Payment: Authorize payment
This section establishes the “Happy Path”—the ideal scenario where the customer submits an order, the web application forwards it to the order service, and the order service requests authorization from the payment gateway.
Phase 3: Handling Conditional Logic with alt Blocks
Real-world systems are rarely linear; they must handle errors and exceptions. This is where the alt (alternative) block comes into play. It allows you to define branching logic based on a condition, such as whether a payment is approved or declined.
In the code, the alt block starts by defining the condition [Payment approved]. Inside this block, we use a dashed arrow (-->) to represent a return message from the server back to the client.
alt Payment approved
    Payment --> Order: Authorization successful
    Order --> Web: Order confirmed
else Payment declined
    Payment --> Order: Authorization failed
    Order --> Web: Show payment error
end
The else keyword handles the alternative scenario. Notice how the logic mirrors the success path but with different messages, ensuring the system handles failure gracefully.
Why Choose Diagram-as-Code?
The image provided demonstrates the power of the “Diagram-as-Code” approach. Instead of manually dragging boxes and trying to align arrows visually, you define the logic in text. This offers several benefits:
- Precision: You avoid alignment errors and spacing issues common in GUI-based tools.
- Version Control Friendly: Since the diagram is text, it can be stored in Git repositories alongside your source code, allowing for proper versioning and code reviews of your architecture.
- Logic Focus: It forces you to think about the sequence of events and conditional logic rather than the aesthetics of the drawing.
By mastering these syntax rules, you can create professional-grade architecture documentation that scales with your software system.