
Mastering UML Use Case Diagrams: A Step-by-Step Guide to System Requirements
In the vast landscape of software architecture, few tools are as effective at bridging the gap between technical complexity and business goals as the Use Case Diagram. As a foundational element of the Unified Modeling Language (UML), this diagram type serves a singular, critical purpose: it describes what a system does, not how it does it.
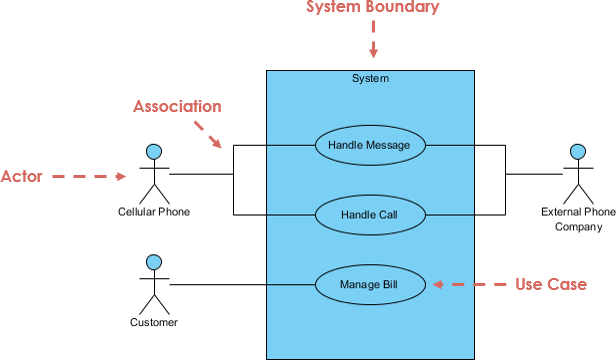
This tutorial will walk you through the anatomy of the diagram provided, explaining the core components—Actors, System Boundaries, and Use Cases—and how they collaborate to define your project’s scope.
Understanding the Core Architecture
A Use Case Diagram is essentially a map of interactions. It visualizes the relationship between the “actors” who interact with the system and the “use cases” that represent specific functionalities. Let’s break down the visual elements shown in our reference diagram.
1. The System Boundary (The Box)
The large blue rectangle represents the System Boundary. This is the demarcation line between the system under development and the outside world. Anything inside the box is part of the software’s responsibility; anything outside is an external entity.
- Function: It defines the scope of the project. If a feature is outside this box, it is not being developed in this specific iteration.
- Labeling: The top of the box is typically labeled with the system name (e.g., “System” or “Customer Portal”).
2. Actors (The Stick Figures)
Actors represent the users or external systems that interact with your software. They are depicted as stick figures outside the system boundary.
In our example diagram, we see three distinct actors:
- Cellular Phone: An external system or device acting as a user interface.
- Customer: A human user interacting with the system.
- External Phone Company: A third-party service provider or legacy system that provides data or services.
Key Insight: An actor does not have to be a person. It can be any external entity that sends a request to the system or receives a result from it.
3. Use Cases (The Ovals)
Use cases are the functional goals of the system. They are represented as ovals floating inside the system boundary. Each oval describes a specific interaction sequence that provides value to an actor.
Looking at the diagram, we identify three specific use cases:
- Handle Message: The system processes incoming text or data messages.
- Handle Call: The system manages voice call routing or recording.
- Manage Bill: The system processes billing information and transactions.
4. Associations (The Lines)
The lines connecting Actors to Use Cases are called Associations. These lines represent the communication flow between the actor and the functionality. If a line connects the “Customer” to “Manage Bill,” it means the Customer initiates or receives data from that specific function.
When to Use Use Case Diagrams
Use Case Diagrams are particularly powerful in the early stages of a project. They are best utilized when:
- Requirements Gathering: You need to interview stakeholders to define what the software must achieve.
- Scope Definition: You need to clearly delineate what is “in” and what is “out” of the system.
- UI Explanation: They are excellent for explaining user interface concepts to non-technical team members.
Unlike Sequence Diagrams, which show the precise timing and order of messages, Use Case Diagrams provide a high-level overview of functionality.
Enhancing Productivity with Visual Paradigm + AI
While understanding the theory is crucial, executing it efficiently requires the right tools. In modern software development, the integration of Visual Paradigm (VP) with AI capabilities has revolutionized how teams handle system architecture.
Seamless Integration for Collaboration
Visual Paradigm offers a robust environment for creating these diagrams, but when paired with AI, the workflow shifts from manual drawing to intelligent design.
- Automated Diagram Generation: Instead of dragging and dropping ovals manually, you can provide a text description of your requirements. The AI engine can instantly generate the Use Case Diagram, identifying potential actors and use cases based on natural language input.
- Consistency Checks: AI tools within the platform can analyze your diagram for logical errors, such as an actor connected to a use case that is logically unrelated to their role.
- Collaborative Efficiency: In a team setting, AI can suggest standard naming conventions or identify missing “happy path” scenarios that a human designer might overlook during a brainstorming session.
Practical Application Scenario
Imagine you are building the billing system shown in the diagram. You could input the following prompt into the AI assistant:
"Create a Use Case Diagram for a billing system.
Actors: Customer, External Phone Company.
Use Cases: Manage Bill, Handle Message, Handle Call.
Ensure the Customer manages their own bill and the Phone Company handles billing data."
The tool will instantly render the structure, allowing the team to focus on refining the logic rather than drawing the shapes. This synergy between human intuition and AI execution significantly boosts team productivity.
Summary
Mastering Use Case Diagrams is about mastering communication. By clearly defining the System Boundary, identifying the correct Actors, and detailing the Use Cases, you create a blueprint that aligns stakeholders and developers. Whether you are sketching it by hand or generating it with AI-powered tools like Visual Paradigm, the goal remains the same: to ensure everyone understands exactly what the system is designed to do.