
Mastering Flowchart Anatomy: A Guide to Visualizing Logic with Standard Symbols
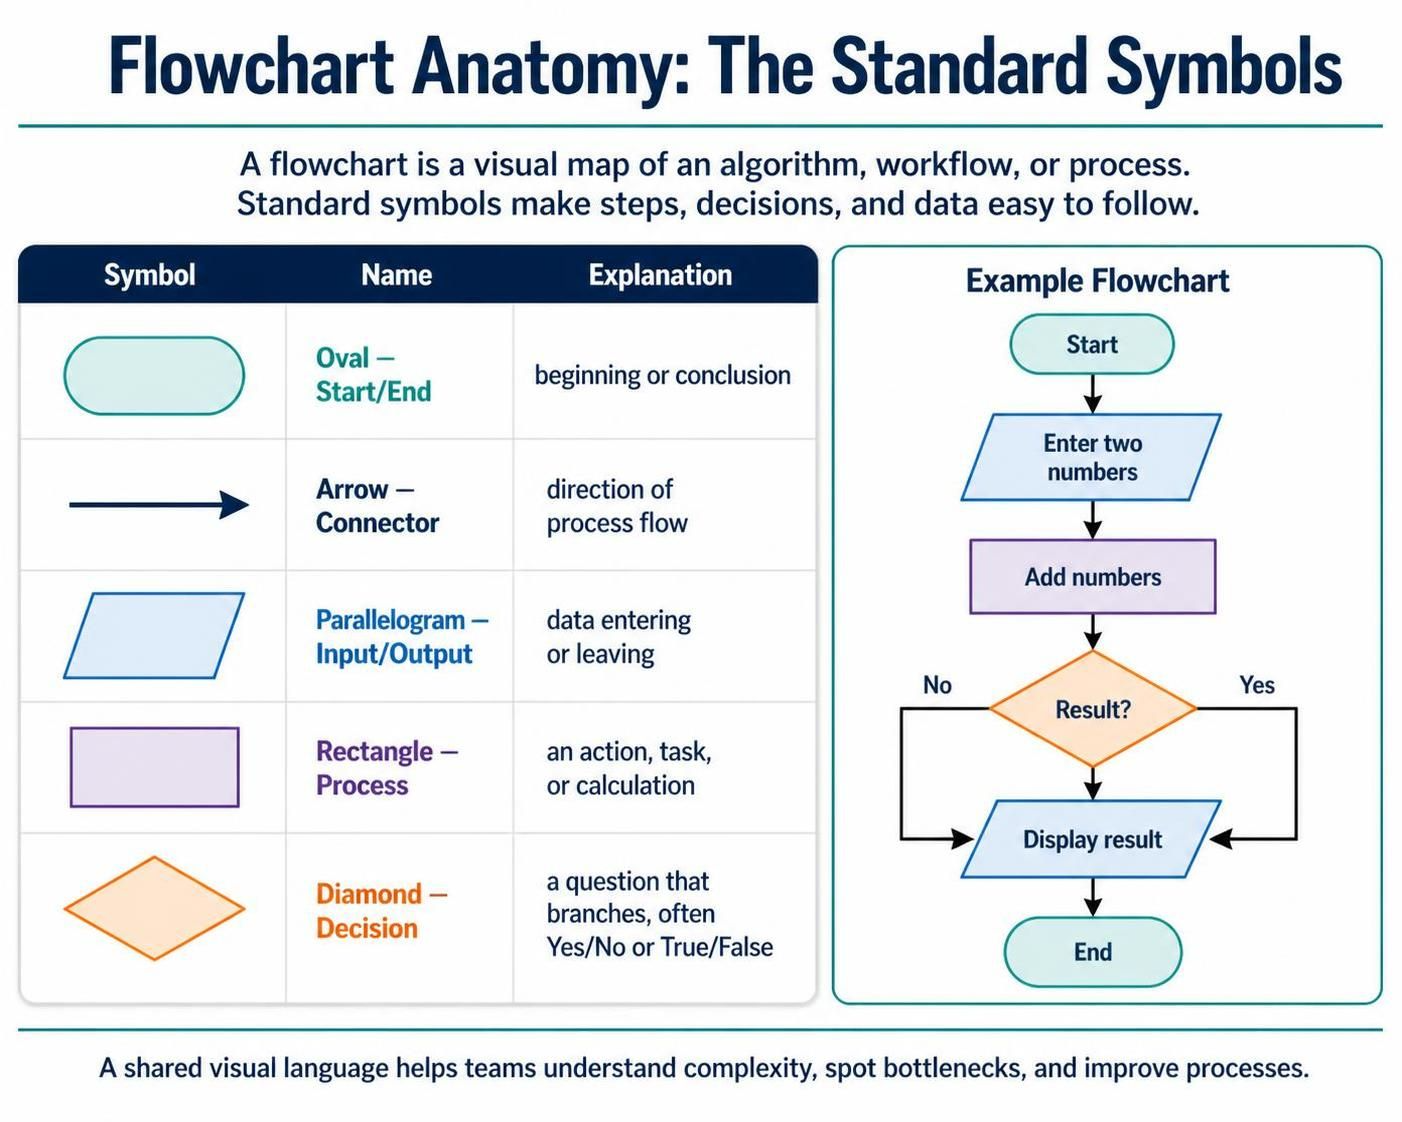
In the rapidly evolving landscape of software development and business process engineering, clarity is paramount. Before a single line of code is written or a new business process is rolled out, stakeholders need a concrete understanding of how a system functions. This is where the Flowchart comes into play. It serves as the universal language for visualizing logic, transforming abstract algorithms into concrete, graphical maps that teams across disciplines can understand.
Based on the foundational principles of the Visual Paradigm ecosystem, this tutorial explores the anatomy of a flowchart. We will break down the standard symbols used to depict steps, decisions, and data flows, and demonstrate how to construct a logical algorithm using a practical example.
The Universal Language of Algorithms
A flowchart is more than just a diagram; it is a visual representation of an algorithm, workflow, or process. By utilizing standardized symbols, flowcharts allow us to:
- Visualize Logic: Turn complex decision trees into readable paths.
- Identify Bottlenecks: Spot where processes get stuck or loop unnecessarily.
- Streamline Operations: Create a blueprint for efficiency before implementation.
Anatomy of a Flowchart: The Standard Symbols
To effectively read or create a flowchart, one must master its vocabulary. The following table outlines the five core components that form the backbone of almost every flowchart diagram.
1. Start/End (Oval)
Function: Entry and Exit Points.
The oval shape represents the beginning and the conclusion of the process. Every valid flowchart must have a clear entry point (Start) and a definitive exit point (End) to ensure the process is finite and traceable.
2. Arrow (Connector)
Function: Flow Direction.
These lines dictate the “flow” of the process. They act as the arrows of time, showing the direction of logic from one step to the next. Without connectors, a flowchart is merely a collection of shapes with no narrative.
3. Input/Output (Parallelogram)
Function: Data Interaction.
The parallelogram indicates data entering the system (Input) or leaving it (Output). This could range from a user typing a password to a system displaying a final report.
4. Process (Rectangle)
Function: Action and Calculation.
This is the “workhorse” of the flowchart. It represents a task, operation, or calculation. Examples include “Add numbers,” “Update database,” or “Sort array.”
5. Decision (Diamond)
Function: Logic Branching.
The diamond is the most critical symbol for logic. It asks a question (usually Yes/No or True/False), creating a branching path in the workflow. It forces the system to make a choice based on current data.
Step-by-Step Modeling: The “Add Numbers” Algorithm
Let us walk through the construction of a simple algorithm to demonstrate how these symbols interact. Our goal is to create a process that takes two numbers, adds them, and checks if the result is positive.
Step 1: Initialization
We begin with the Oval to mark the start of the process.
Step 2: Data Acquisition
Next, we use a Parallelogram to represent the Input. The system needs to know what to add.
Step 3: Execution
We proceed to a Rectangle (Process) where the actual addition takes place.
Step 4: Logic Evaluation
Here comes the Diamond (Decision). We ask: “Is the result greater than zero?” This creates two paths: one for “Yes” and one for “No.”
Step 5: Output and Termination
Both paths eventually lead to an Input/Output symbol (Display result) before finally closing at the Oval (End).
Visualizing the Logic with VPasCode
When using tools like Visual Paradigm’s VPasCode, you can translate this visual logic into a structured text format that can be rendered into a diagram. This approach ensures that the logic is consistent and editable.
Below is a representation of the logic discussed above, structured as it would appear in a modeling environment:
Start
  |
  v
[Input: Enter two numbers]
  |
  v
[Process: Add numbers]
  |
  v
< [Result > 0?] --No--> [Display result]
  | Yes                 ^
  v                     |
[Display result] --------+
  |
  v
End
In a formal modeling tool, this logic is represented by connecting the specific shapes defined in our anatomy section. The VPasCode tool allows you to define these nodes and edges programmatically, ensuring that the flow remains linear and logical.
Conclusion
By mastering these five symbols and understanding how they form a cohesive narrative, you gain the ability to communicate complex system architectures with precision. Whether you are debugging a codebase or redesigning a business workflow, the flowchart remains an essential tool for visualizing logic and improving processes.