
Mastering DFDs: AI-Assisted System Architecture & Data Flow Framework
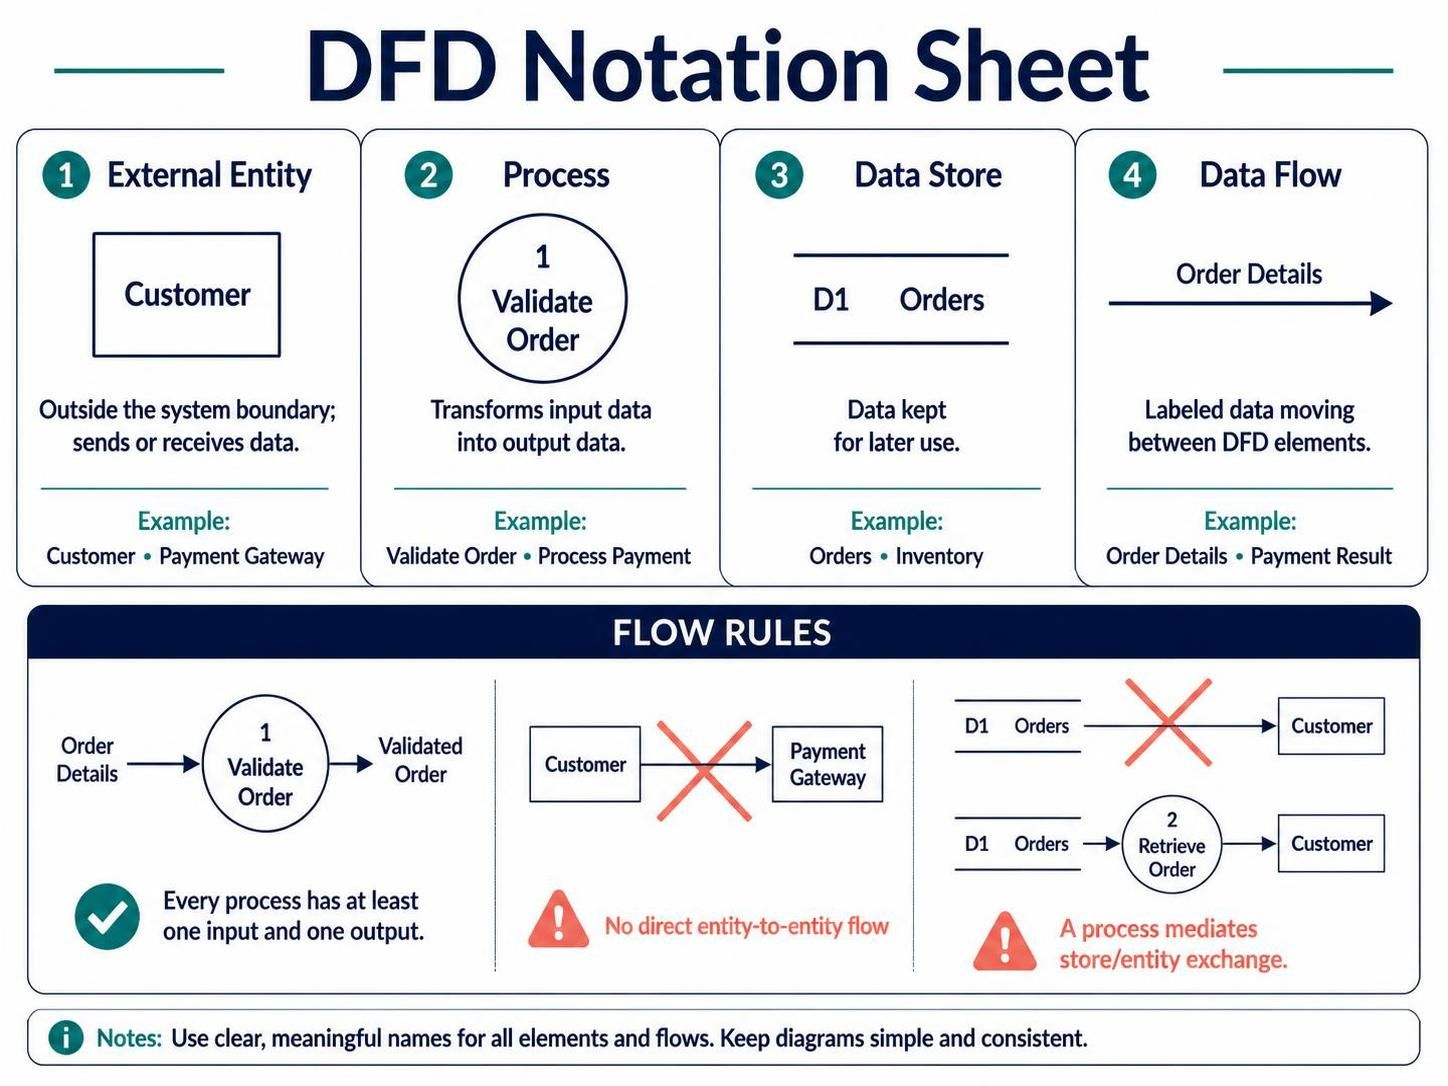
When architects and business analysts need to visualize how information moves through a system, few tools are as powerful or intuitive as the Data Flow Diagram (DFD). This tutorial breaks down the fundamental building blocks of DFDs, explains the strict logical rules that govern them, and demonstrates how to use modern AI-assisted tools like Visual Paradigm to create professional system models.
The Four Pillars of DFD Notation
A Data Flow Diagram is not just a collection of shapes; it is a language. To read or write a DFD effectively, you must understand the four basic elements that make up this notation. These elements work together to show the lifecycle of data within a specific context.
1. External Entity (The Source and Sink)
External entities represent the “actors” in your system. These are people, organizations, or other computer systems that exist outside the boundary of the system you are modeling. They are the starting point or the final destination for data.
- Role: They send data into the system (Source) or receive data from the system (Sink).
- Example: A Customer placing an order or a Payment Gateway confirming a transaction.
- Visual Representation: Typically drawn as a rectangle or square.
2. Process (The Transformation Engine)
Processes are the heart of the system. They represent the logic, functions, or actions that transform input data into output data. A process is where the “work” happens.
- Role: It takes raw data, applies rules or logic, and produces a result.
- Example: Validate Order checks if an order is complete, or Process Payment calculates the total.
- Visual Representation: Usually depicted as a circle or a rounded rectangle.
3. Data Store (The Memory)
Data stores represent where information is kept for later use. Unlike a process, a data store does not change the data; it simply holds it.
- Role: Persistent storage for data required by the system.
- Example: An Orders database or an Inventory list.
- Visual Representation: Often shown as an open rectangle or a cylinder.
4. Data Flow (The Nervous System)
Data flows are the arrows that connect the elements. They represent the labeled movement of data between entities, processes, and stores.
- Role: They indicate what information is being passed and in which direction.
- Example: Order Details, Payment Result, or Invoice.
- Visual Representation: A directed line (arrow) with a descriptive label.
Strict Flow Rules and Logical Integrity
Creating a DFD is not merely about drawing lines; it is about adhering to strict logical rules that ensure the model accurately reflects reality. Violating these rules can lead to a model that is technically impossible to implement.
The “Black Box” Rule: Input and Output
Every process in a DFD must act as a transformer. It cannot be a “magic” generator. Therefore, a fundamental rule is that every process must have at least one input and one output. If a circle has no arrows entering it, where is the data coming from? If no arrows leave it, where does the result go?
The “No Direct Contact” Rule
Data cannot flow directly between two external entities. Imagine a Customer sending data directly to a Payment Gateway without the system knowing about it. This breaks the system boundary. A process must always mediate this exchange.
The “System Boundary” Rule
Similarly, data cannot flow directly between a Data Store and an External Entity. The data must first be retrieved by a process, which then decides to send it to the entity. This ensures that the data being retrieved is relevant and processed correctly.
Levels and Decomposition
A single DFD rarely captures the entire complexity of a system. Instead, we use a technique called Decomposition to break the system down into levels.
Level 0: The Context Diagram
The Context Diagram is the highest level view. It represents the entire system as a single process and shows how it interacts with all external entities. It answers the question: “What is the scope of this system?”
Level 1: The Breakdown
Once the context is defined, the single process is decomposed (split) into major sub-processes. This level details the major functions, such as “Order Management” or “Inventory Control,” and introduces the first level of data stores.
Level 2 and Below
Further decomposition drills down into specific, granular functions. This is often where business analysts and developers collaborate to define specific logic and data structures.
Visualizing the Model with AI Assistance
Modern tools like Visual Paradigm leverage AI to assist in the creation of these diagrams. Instead of manually dragging and dropping shapes, you can describe the system flow, and the AI can generate the structure for you.
For example, when modeling an e-commerce system, you might prompt the AI to create a context diagram. The AI will automatically identify the External Entities (Customer, Supplier) and the central Process, then suggest the necessary Data Flows. It ensures that the resulting diagram respects the rules of decomposition and flow logic discussed earlier.
By combining the theoretical understanding of DFD notation with the efficiency of AI-assisted tooling, you can rapidly prototype system architectures and communicate complex data relationships with clarity and precision.