
Mastering BPMN: Visualizing the Workflow Lifecycle with Visual Paradigm
In the complex world of business operations, clarity is currency. Business Process Model and Notation (BPMN) serves as the universal language for describing how work moves from a specific trigger to a desired outcome. This tutorial explores the architecture of a standard process model, utilizing the capabilities of Visual Paradigm with AI integration to streamline the transition from conceptualization to implementation.
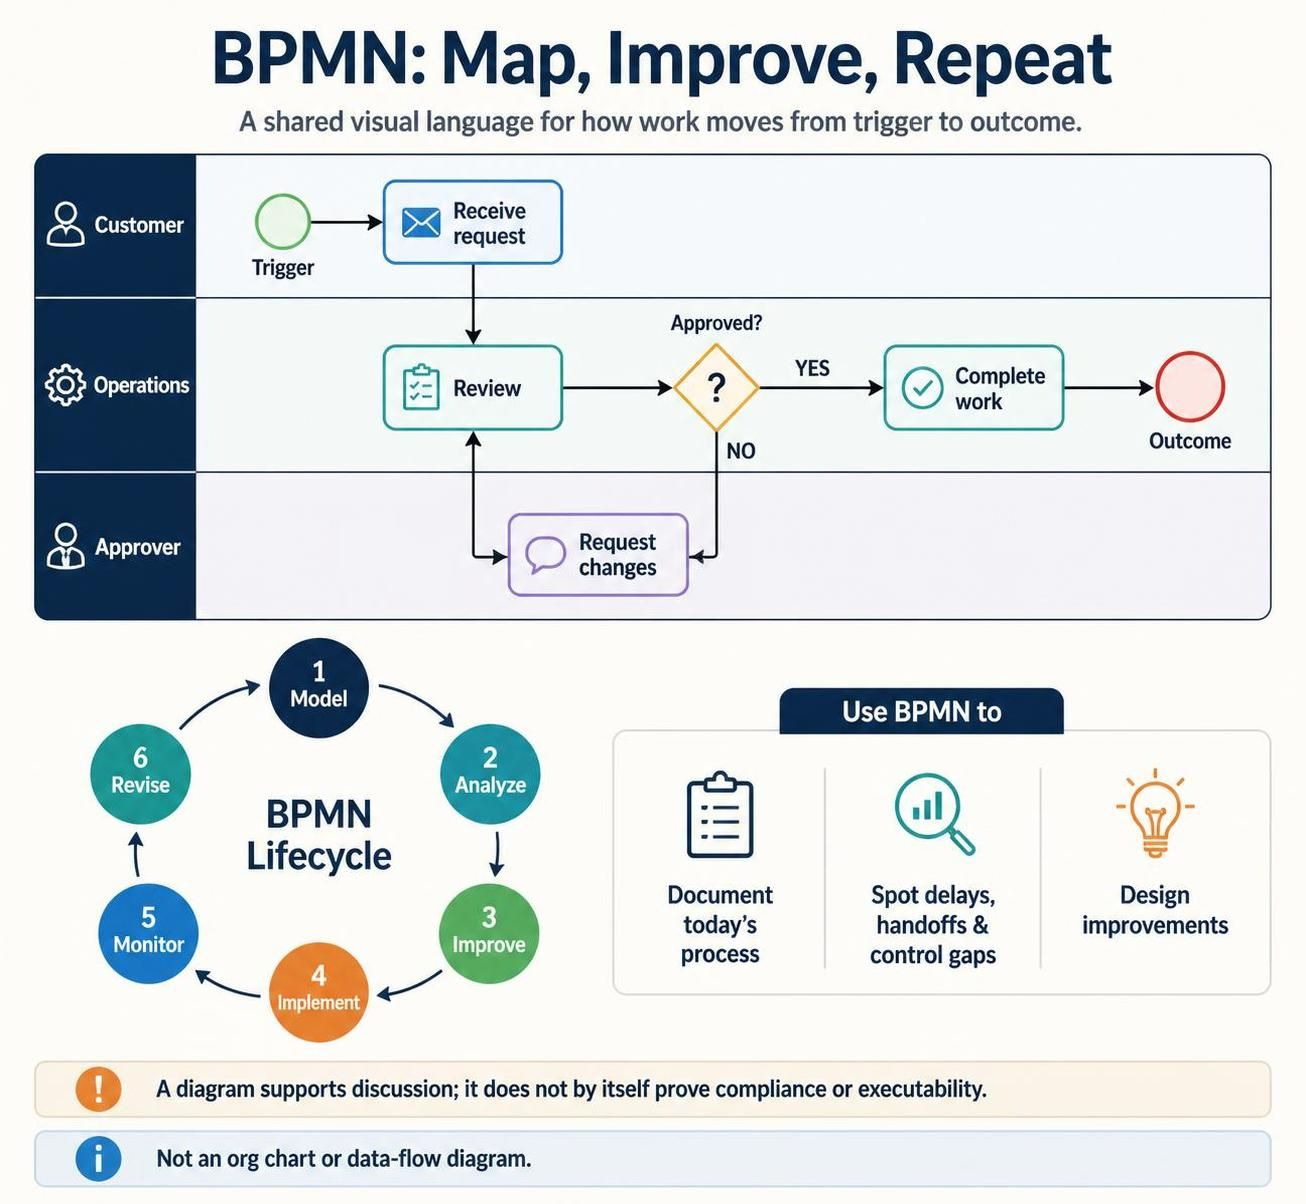
The image provided illustrates a fundamental BPMN scenario: a request review process. By breaking this down into swimlanes, we can see how different roles—Customer, Operations, and Approver—interact. Let’s walk through the anatomy of this model and the iterative lifecycle that drives process improvement.
1. The Anatomy of a BPMN Model
At its core, BPMN relies on “Swimlanes” to organize tasks by responsibility. In our example, the process is divided into three distinct horizontal pools, representing the actors involved in the workflow.
- The Trigger (Customer): Every process requires an initiator. In this diagram, a Start Event (the green circle) labeled “Receive request” signifies the moment a customer initiates the work. This is the entry point of the process.
- The Task (Operations): The “Review” task (rectangle with a document icon) represents the work performed by the Operations team. This is a specific activity that consumes time and resources.
- The Decision (Gateways): The diamond shape labeled “Approved?” is a Exclusive Gateway. It acts as a traffic controller, forcing the process down one of two paths based on a binary condition (YES or NO).
- The Outcome: The red circle at the end represents the End Event, signaling that the process is complete and a deliverable has been produced.
2. Navigating Logic and Control Flow
Understanding the logic flow is critical for accurate modeling. The diagram demonstrates a classic “Loop and Correction” pattern.
If the Operations team reviews the request and the decision is “NO,” the flow does not simply stop. Instead, it passes through a communication flow to the Approver lane to “Request changes.” This creates a feedback loop. The process returns to the “Review” task, ensuring that the work is not finalized until it meets the necessary criteria.
This structure highlights the importance of defining control flow (the sequence of activities) versus data flow (the movement of information). As noted in the context, BPMN is not a substitute for a data-flow diagram, but it effectively maps where data is consumed and produced within the logic.
3. The BPMN Lifecycle
A diagram is a static snapshot of a dynamic reality. To truly manage business value, BPMN is employed within an iterative lifecycle. The image outlines a robust 6-step framework:
- Model: Capture the current state of affairs (As-Is) to establish a baseline.
- Analyze: Use the model to identify bottlenecks, delays, and unnecessary handoffs between swimlanes.
- Improve: Design the future state (To-Be), optimizing the logic and removing redundant steps.
- Implement: Deploy the process, potentially using execution engines or manual SOPs.
- Monitor: Track performance metrics against the model to ensure compliance and efficiency.
- Revise: Based on monitoring data, return to the modeling phase to refine the process further.
4. Using Tools for Efficiency
Tools like Visual Paradigm with AI integration automate much of the heavy lifting in this lifecycle. Instead of manually drawing connectors, AI can suggest process flows based on natural language descriptions. This allows analysts to focus on the logic (the “Why” and “How”) rather than the geometry of the diagram.
Key Takeaway: A diagram supports discussion; it does not by itself prove compliance or executability. The model is a tool for shared understanding, bridging the gap between technical teams and business stakeholders.