
Mastering BPMN 2.0 with VPasCode: AI-Driven Visual Architecture for Process Modeling
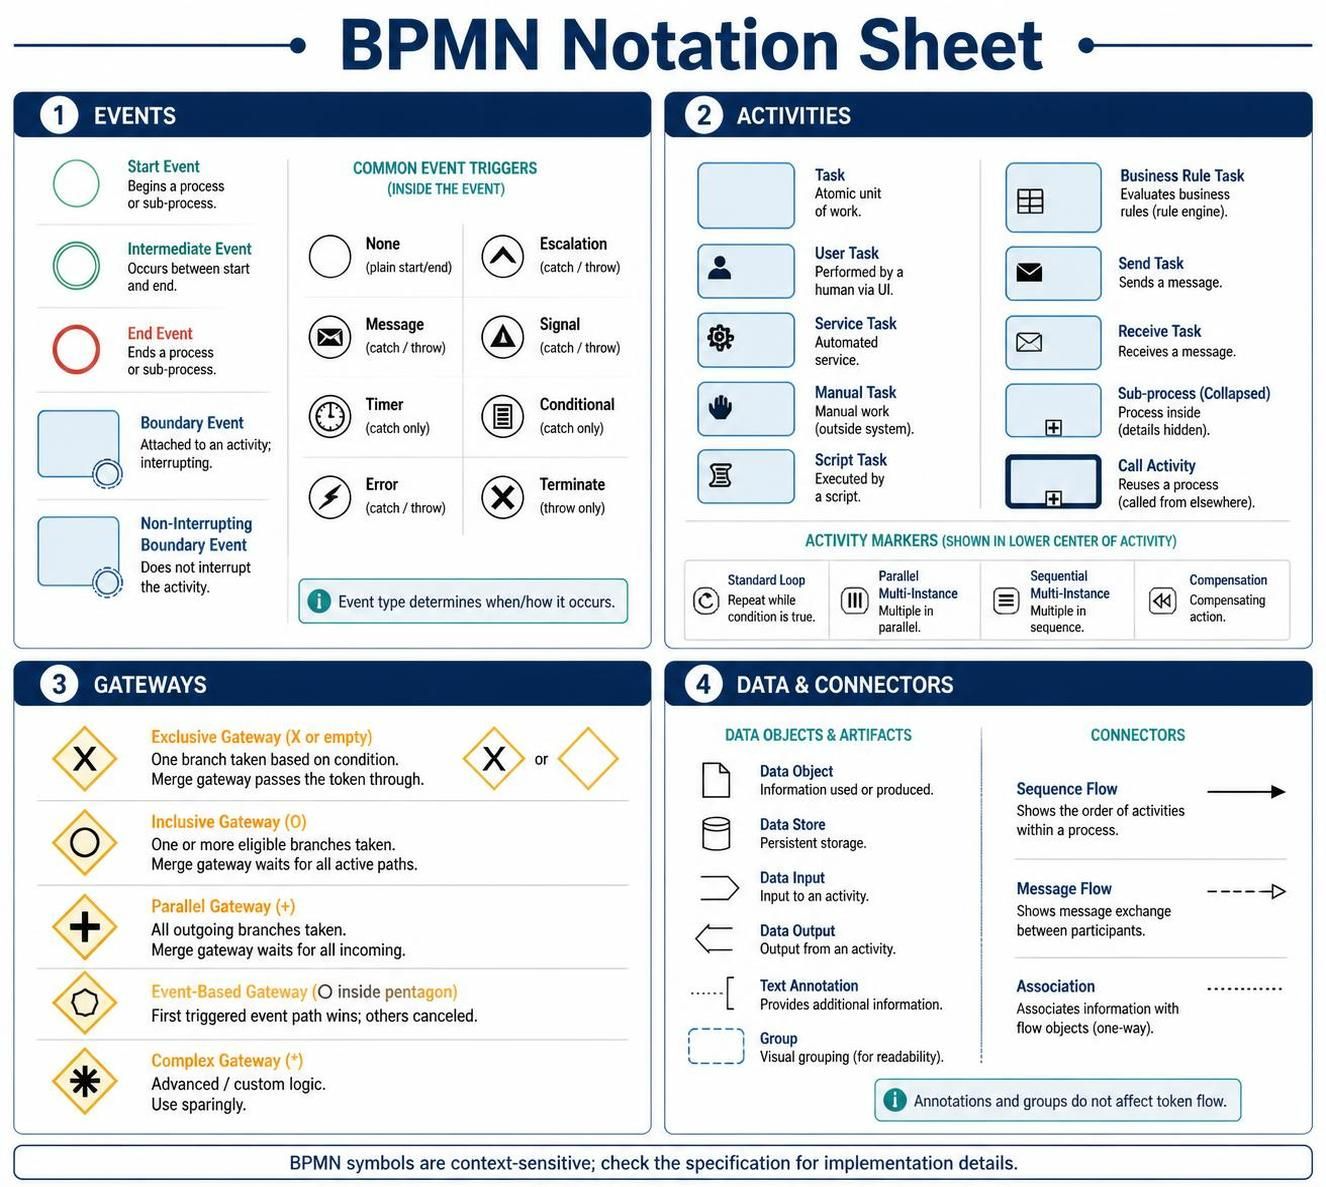
In the realm of Business Process Management (BPM), clarity is currency. Without a standardized language, complex organizational workflows remain invisible and unoptimized. The Business Process Model and Notation (BPMN) 2.0 specification serves as the universal grammar for this domain, transforming abstract business logic into executable, visual blueprints. This tutorial deconstructs the four pillars of BPMN architecture—Events, Activities, Gateways, and Data/Connectors—providing a comprehensive guide to constructing robust process diagrams using tools like Visual Paradigm.
1. The Heartbeat of the Process: Events
Every process has a beginning, a middle, and an end, but BPMN allows for far more nuance. Events are represented by circles and define something that happens. They are not actions themselves but rather the triggers or results of actions.
Start and End Events
The lifecycle of a process instance is bounded by Start and End events. The Start Event initiates the flow, while the End Event concludes it. In the notation sheet, these are depicted as thin-lined circles. A single process instance can have multiple end events, representing different outcomes (e.g., “Order Approved” vs. “Order Cancelled”).
Intermediate Events
Intermediate events occur between the start and end of a process. They are crucial for modeling waiting periods or external interactions. A double-line circle indicates an intermediate event. These are often paired with triggers:
- Message: Waiting for a message from another participant.
- Timer: Waiting for a specific time or duration.
- Error: Handling exceptions or faults.
Boundary Events
Attached directly to the side of an activity, Boundary Events allow you to model exceptions without cluttering the main flow. For example, if a “Payment” activity takes too long, a timer boundary event can trigger a “Cancel Order” action. If it does not interrupt the main flow, it is a non-interrupting boundary event.
2. The Work of the Process: Activities
Activities are the “doing” parts of a process. Represented by rounded rectangles, they describe the work performed within a process. Visual Paradigm categorizes these to help modelers specify exactly who or what is doing the work.
User and Manual Tasks
The standard Task is an atomic unit of work. However, specificity is key for execution. A User Task explicitly denotes work performed by a human via a user interface (UI). Conversely, a Manual Task represents work outside the automated system, perhaps involving physical paperwork or a phone call that isn’t directly supported by software.
Automated and Scripted Work
When a process requires system intervention, we use a Service Task (an automated service call) or a Script Task (executed by a script). These bridge the gap between business logic and technical implementation, allowing the diagram to represent complex backend logic simply.
Sub-processes and Call Activities
Complex processes are best broken down. A Sub-process encapsulates a detailed set of steps within a single activity. It can be “collapsed” (details hidden) for a high-level view or “expanded” for detailed modeling. A Call Activity is distinct because it reuses an existing process definition from elsewhere, promoting modularity and standardization.
3. The Logic of the Process: Gateways
If events are the heartbeat and activities are the muscles, Gateways are the brain. They control the divergence and convergence of the flow based on logic. Gateways are the primary mechanism for introducing decision-making and parallelism.
Exclusive Gateway (XOR)
The diamond with an “X” is the most common gateway. It represents a decision point where only one path is taken. If the condition is met, the token flows one way; if not, it flows the other. Crucially, the exclusive gateway waits for all incoming tokens before evaluating the outgoing conditions.
Inclusive Gateway (OR)
Unlike the Exclusive gateway, the Inclusive Gateway allows for one or more paths to be taken simultaneously. It is ideal for scenarios where multiple conditions might be true at once (e.g., “If Customer is VIP, send email AND send discount code”).
Parallel Gateway (AND)
Marked by a plus sign (+), the Parallel Gateway splits a flow into multiple concurrent paths. It does not evaluate conditions; it simply forks the execution. To merge these paths back together, a parallel gateway is required to wait for all incoming tokens before proceeding.
4. Connecting the Architecture: Data & Flow
Finally, the diagram must be connected. The lines you draw dictate how the process moves and what data is exchanged.
Sequence Flow vs. Message Flow
The distinction between these two is the boundary between “Inside” and “Outside.” A Sequence Flow (solid arrow) shows the order of activities within a single participant or pool. A Message Flow (dashed arrow) represents communication between two different participants (Pools). Confusing these is a common modeling error; remember: Message Flows cross the boundary; Sequence Flows stay inside.
Data Objects
Processes manipulate data. A Data Object represents information used or produced by an activity. While it doesn’t control flow, it provides context. For instance, a “Purchase Order” data object might be an input to a “Validate Order” task and an output from an “Approve Order” task.
Conclusion
Mastering BPMN requires understanding not just the shapes, but the logic they enforce. By combining precise Event definitions, granular Activities, logical Gateways, and clear Data flows, you create a living blueprint that is both readable for humans and executable by machines. Whether you are using Visual Paradigm’s AI-assisted modeling or manual diagramming, these core concepts remain the bedrock of effective process architecture.