


Introduction
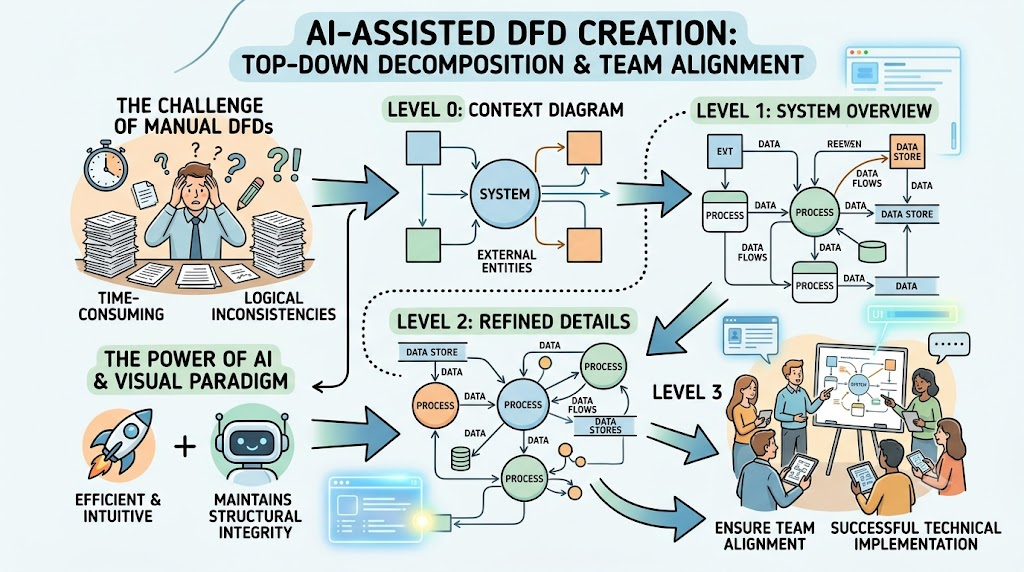
In modern system analysis and product management, the ability to visualize complex data movements is not just a documentation exercise—it is a critical communication bridge between business stakeholders and technical teams. Data Flow Diagrams (DFDs) remain the gold standard for mapping how information moves through a system. However, traditional manual DFD creation is often fraught with challenges: maintaining consistency across hierarchy levels, avoiding logical errors like “black holes,” and managing the sheer time investment required for multi-level decomposition.
The integration of Artificial Intelligence into modeling tools has fundamentally shifted this paradigm. This comprehensive guide explores how to leverage the Visual Paradigm (VP) AI Chatbot to perform Top-Down Decomposition efficiently. By combining foundational DFD theory with AI-driven generation, you can move from high-level context diagrams to granular Level 3 process details through natural language conversation. This approach not only accelerates diagramming but also ensures structural integrity and balancing across your entire system architecture.
Part 1: Core Concepts of Data Flow Diagrams
Before utilizing AI tools, it is essential to understand the theoretical framework that governs valid DFDs. AI assistants are powerful, but they require users who understand the underlying rules to validate outputs and provide effective prompts.
What is a Data Flow Diagram?
A DFD is a graphical representation of the “flow” of data in an information system. It models the processes that transform inputs into outputs, independent of the physical technology used. There are two primary perspectives:
-
Logical DFD: Focuses on what the system does (business functions). It is stable and technology-agnostic.
-
Physical DFD: Focuses on how the system is implemented (hardware, software, manual steps, specific file names).
The Four Fundamental Symbols
Valid DFDs rely on four standardized symbols. Understanding these is crucial for interpreting AI-generated diagrams.
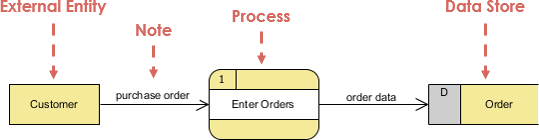
1. Process
Represents a transformation of data. Must have a verb-noun label (e.g., “Validate Order”).
-
Rule: Must have at least one input and one output.
-
Notation: Rounded rectangle or circle.

2. Data Flow
The path data takes between components. Represents data in motion, not control flow.
-
Rule: Cannot connect Entity-to-Entity, Entity-to-Store, or Store-to-Store directly. All flows must involve a process.
-
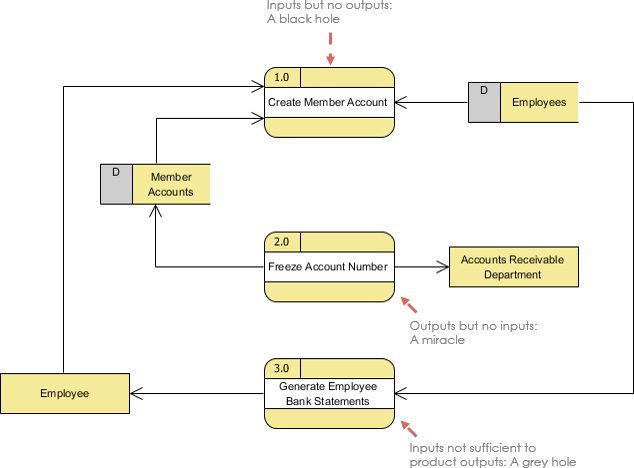
Common Errors: Black holes (input only), Miracles (output only), Grey holes (output > input).
| Wrong | Right | Description |
|---|---|---|
 |
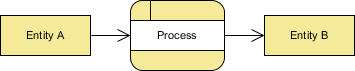 |
An entity cannot provide data to another entity without some processing occurred. |
 |
 |
Data cannot move directly from an entity to a data store without being processed. |
 |
 |
Data cannot move directly from a data store without being processed. |
 |
 |
Data cannot move directly from one data store to another without being processed. |
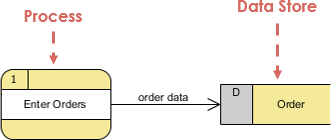
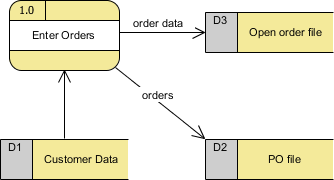
3. Data Store
Data at rest. Represents files, databases, or physical records.
-
Rule: Must be connected to a process. Requires both input (write) and output (read) flows over the system lifecycle.

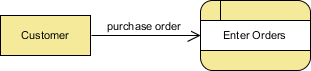
4. External Entity
Sources or destinations outside the system boundary (people, other systems).
-
Rule: Can only connect to processes, never directly to stores or other entities.

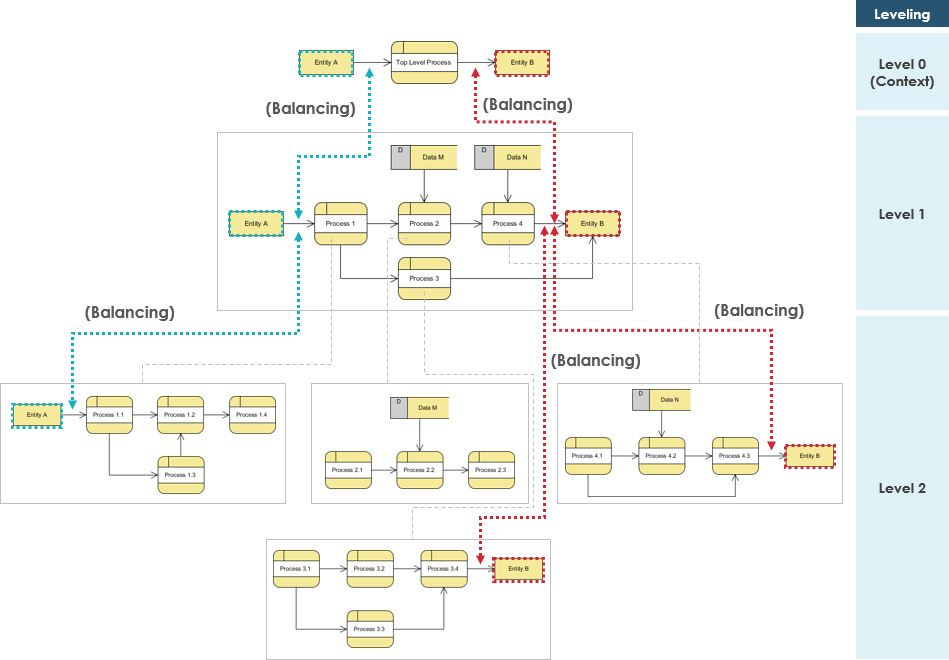
Key Concept: Balancing and Levels
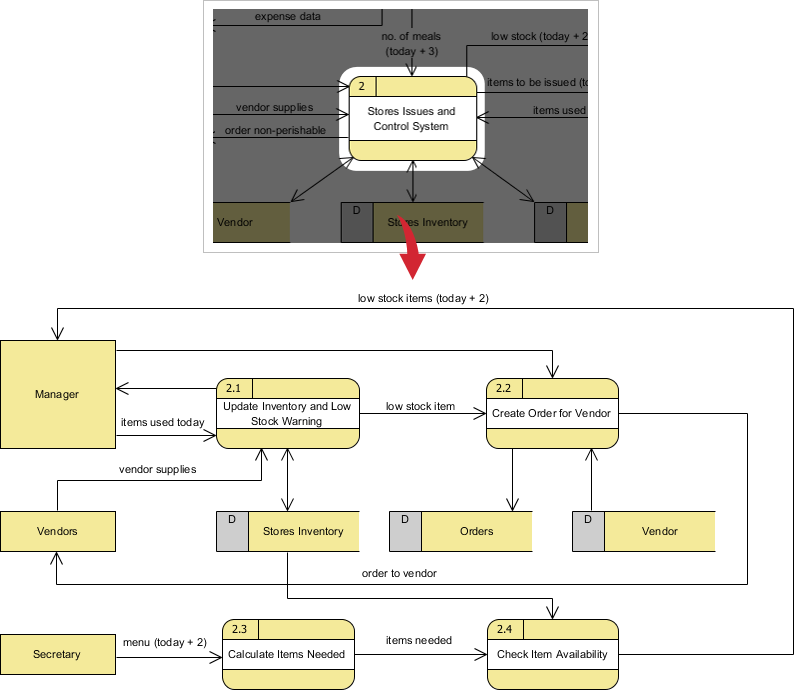
Top-down decomposition relies on balancing. The inputs and outputs of a child diagram (Level n+1) must exactly match the inputs and outputs of the parent process (Level n) it decomposes.
-
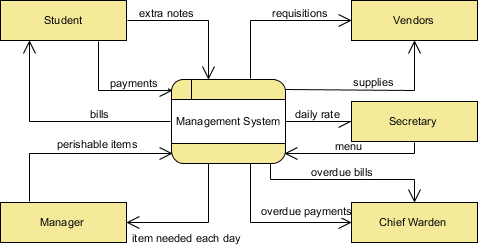
Context Diagram (Level 0): Single process representing the whole system. No data stores.
-
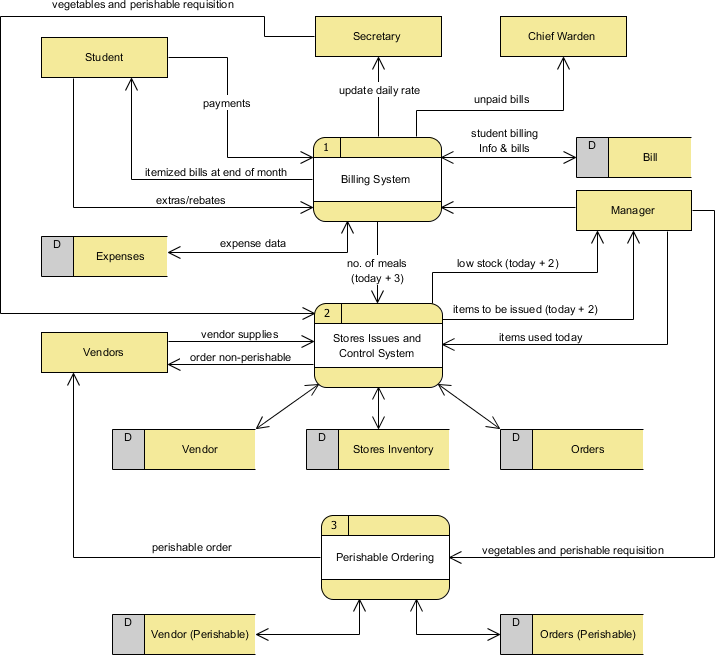
Level 1: Major functional processes and primary data stores.
-
Level 2+: Detailed sub-processes. Keep to 7±2 processes per diagram for readability.
Part 2: AI-Assisted Modeling Workflow with Visual Paradigm
The Visual Paradigm AI Chatbot transforms DFD creation from a drawing task into a conversational design session. Below is a step-by-step workflow using an “Online Order Process System” case study.
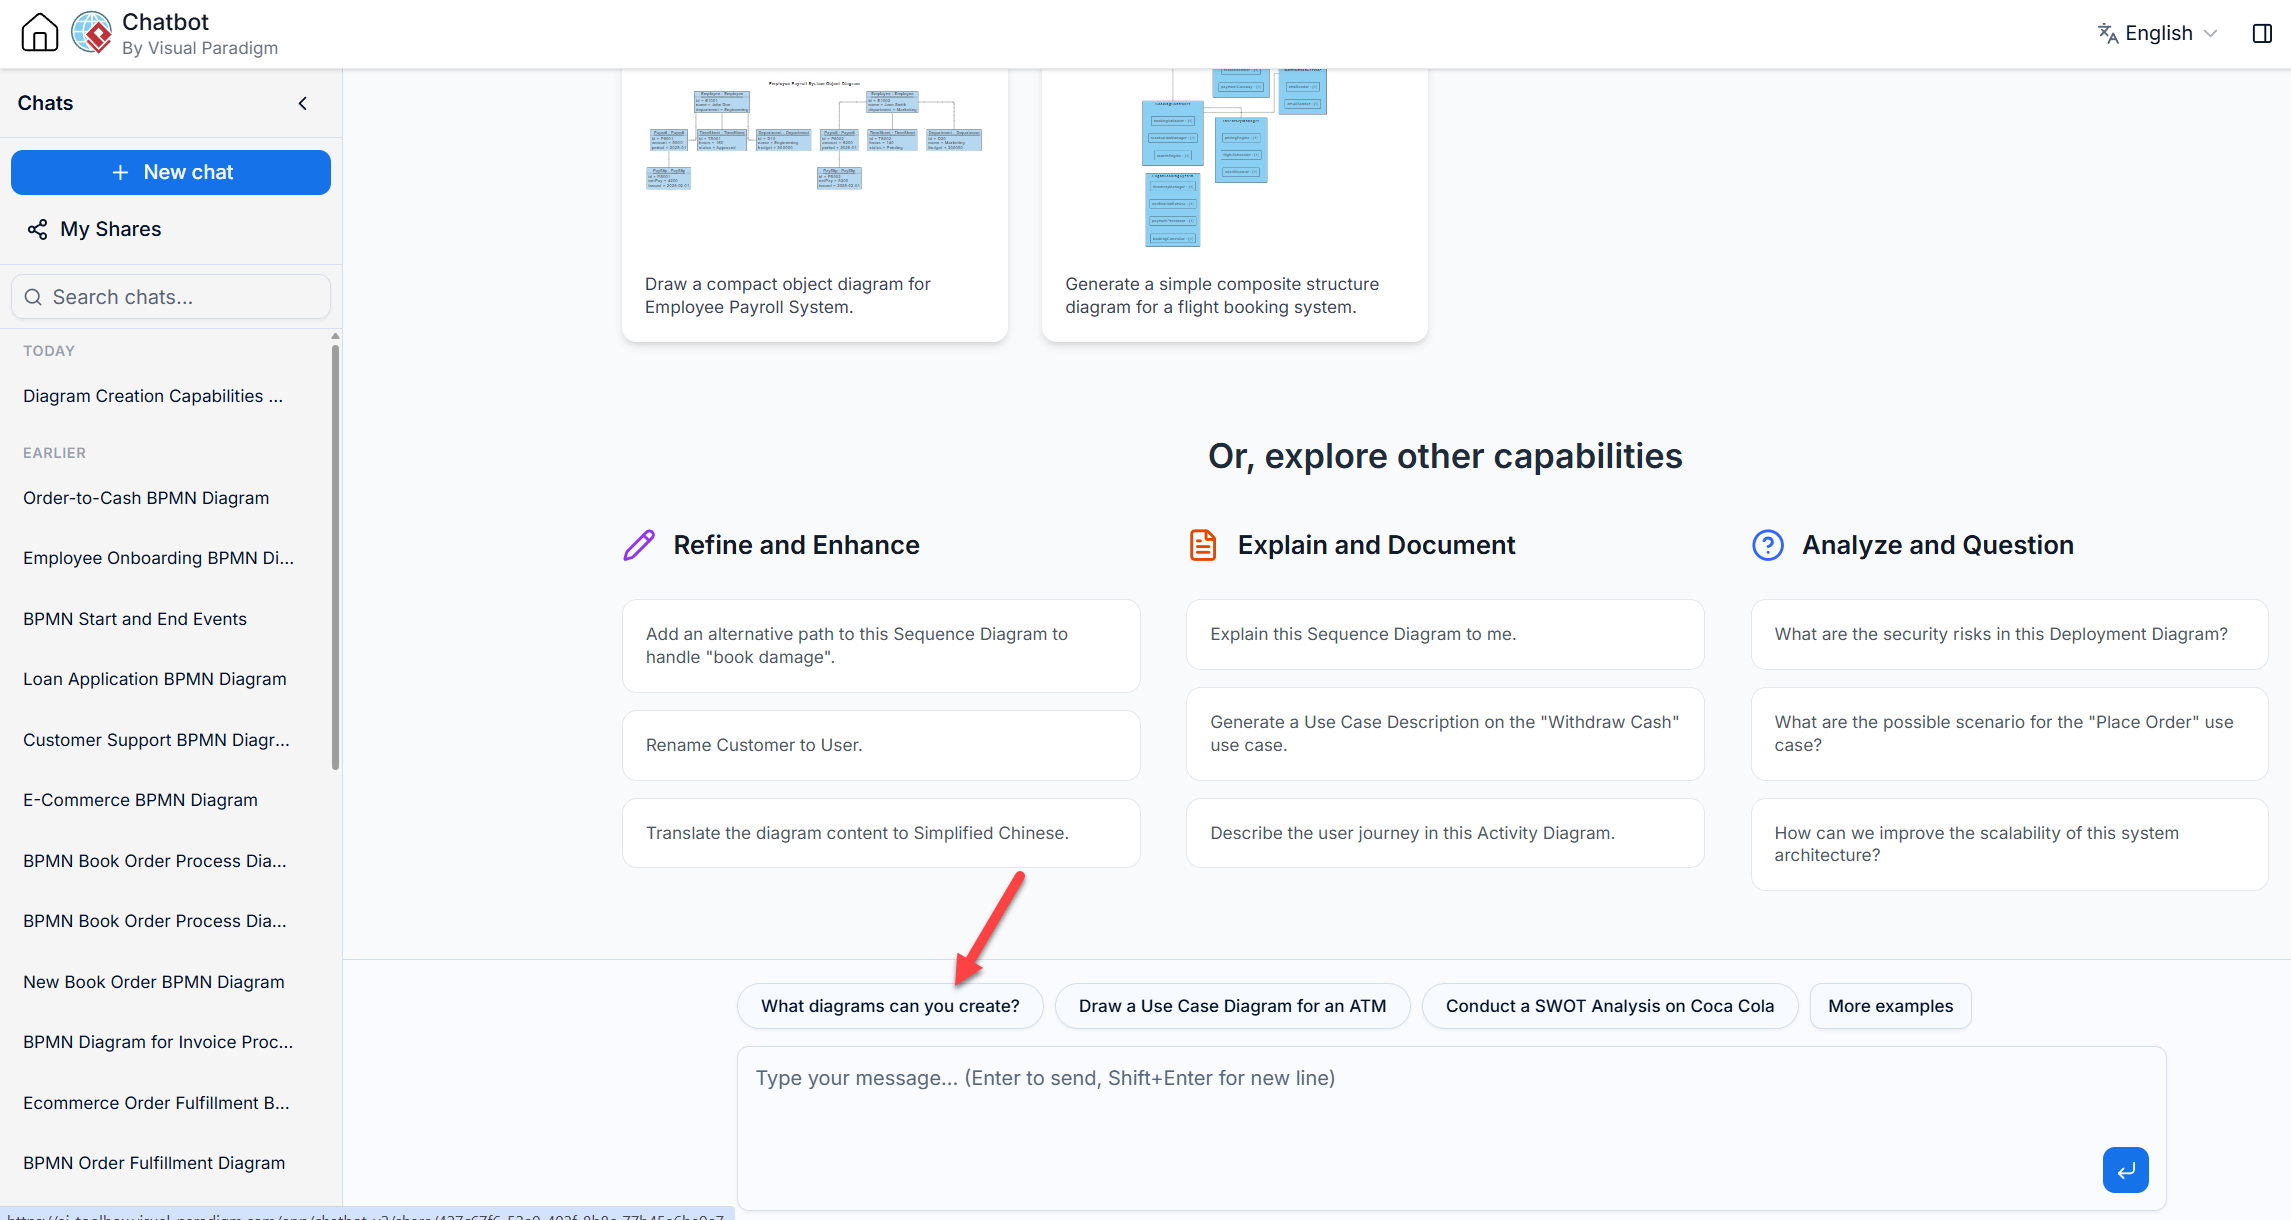
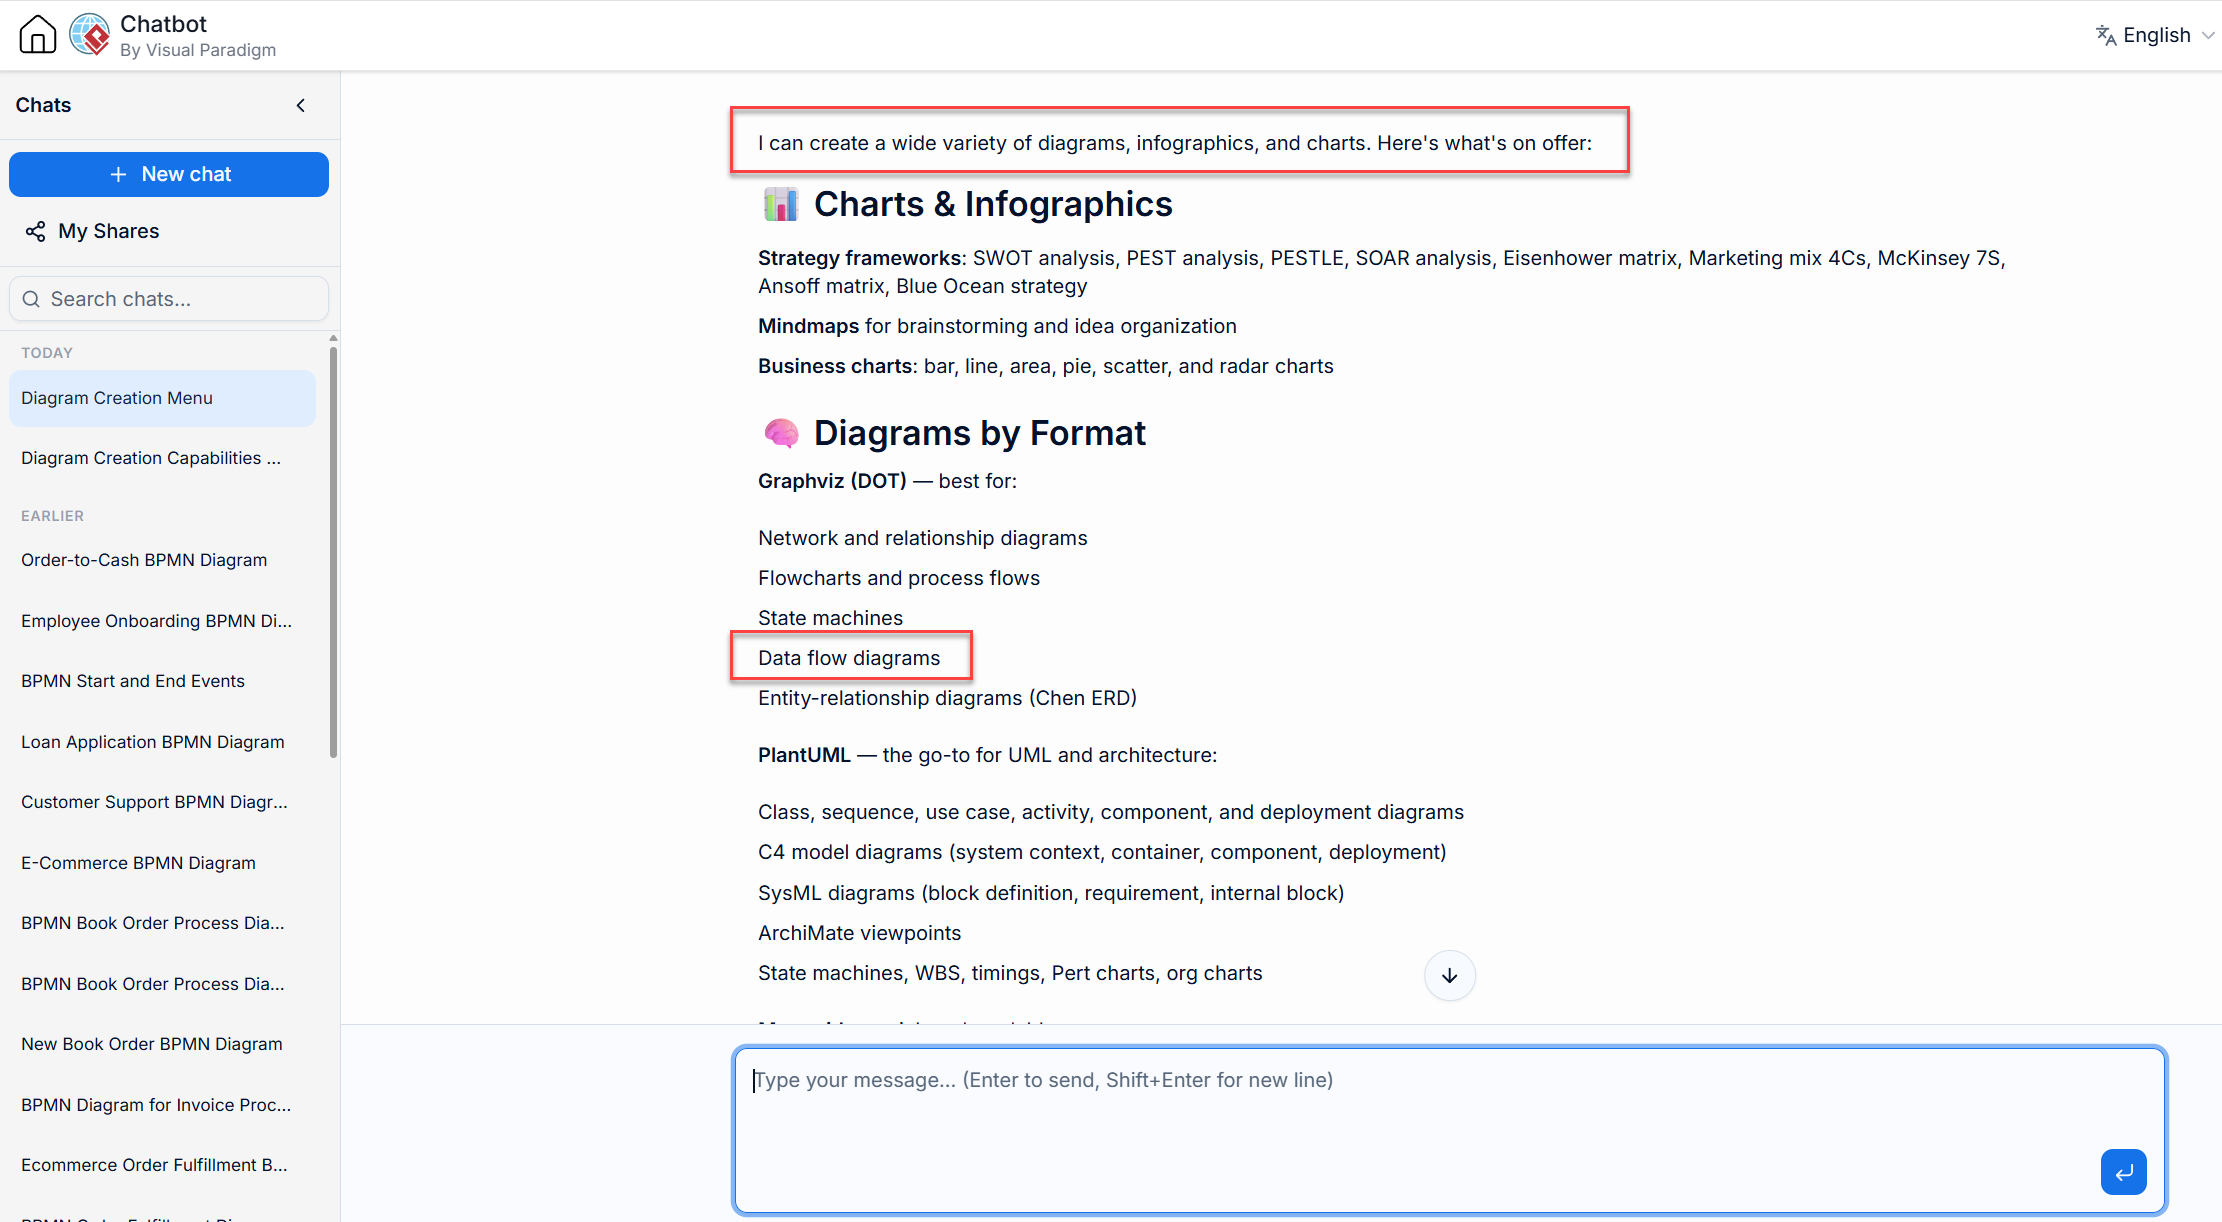
Step 1: Initiating the AI Session
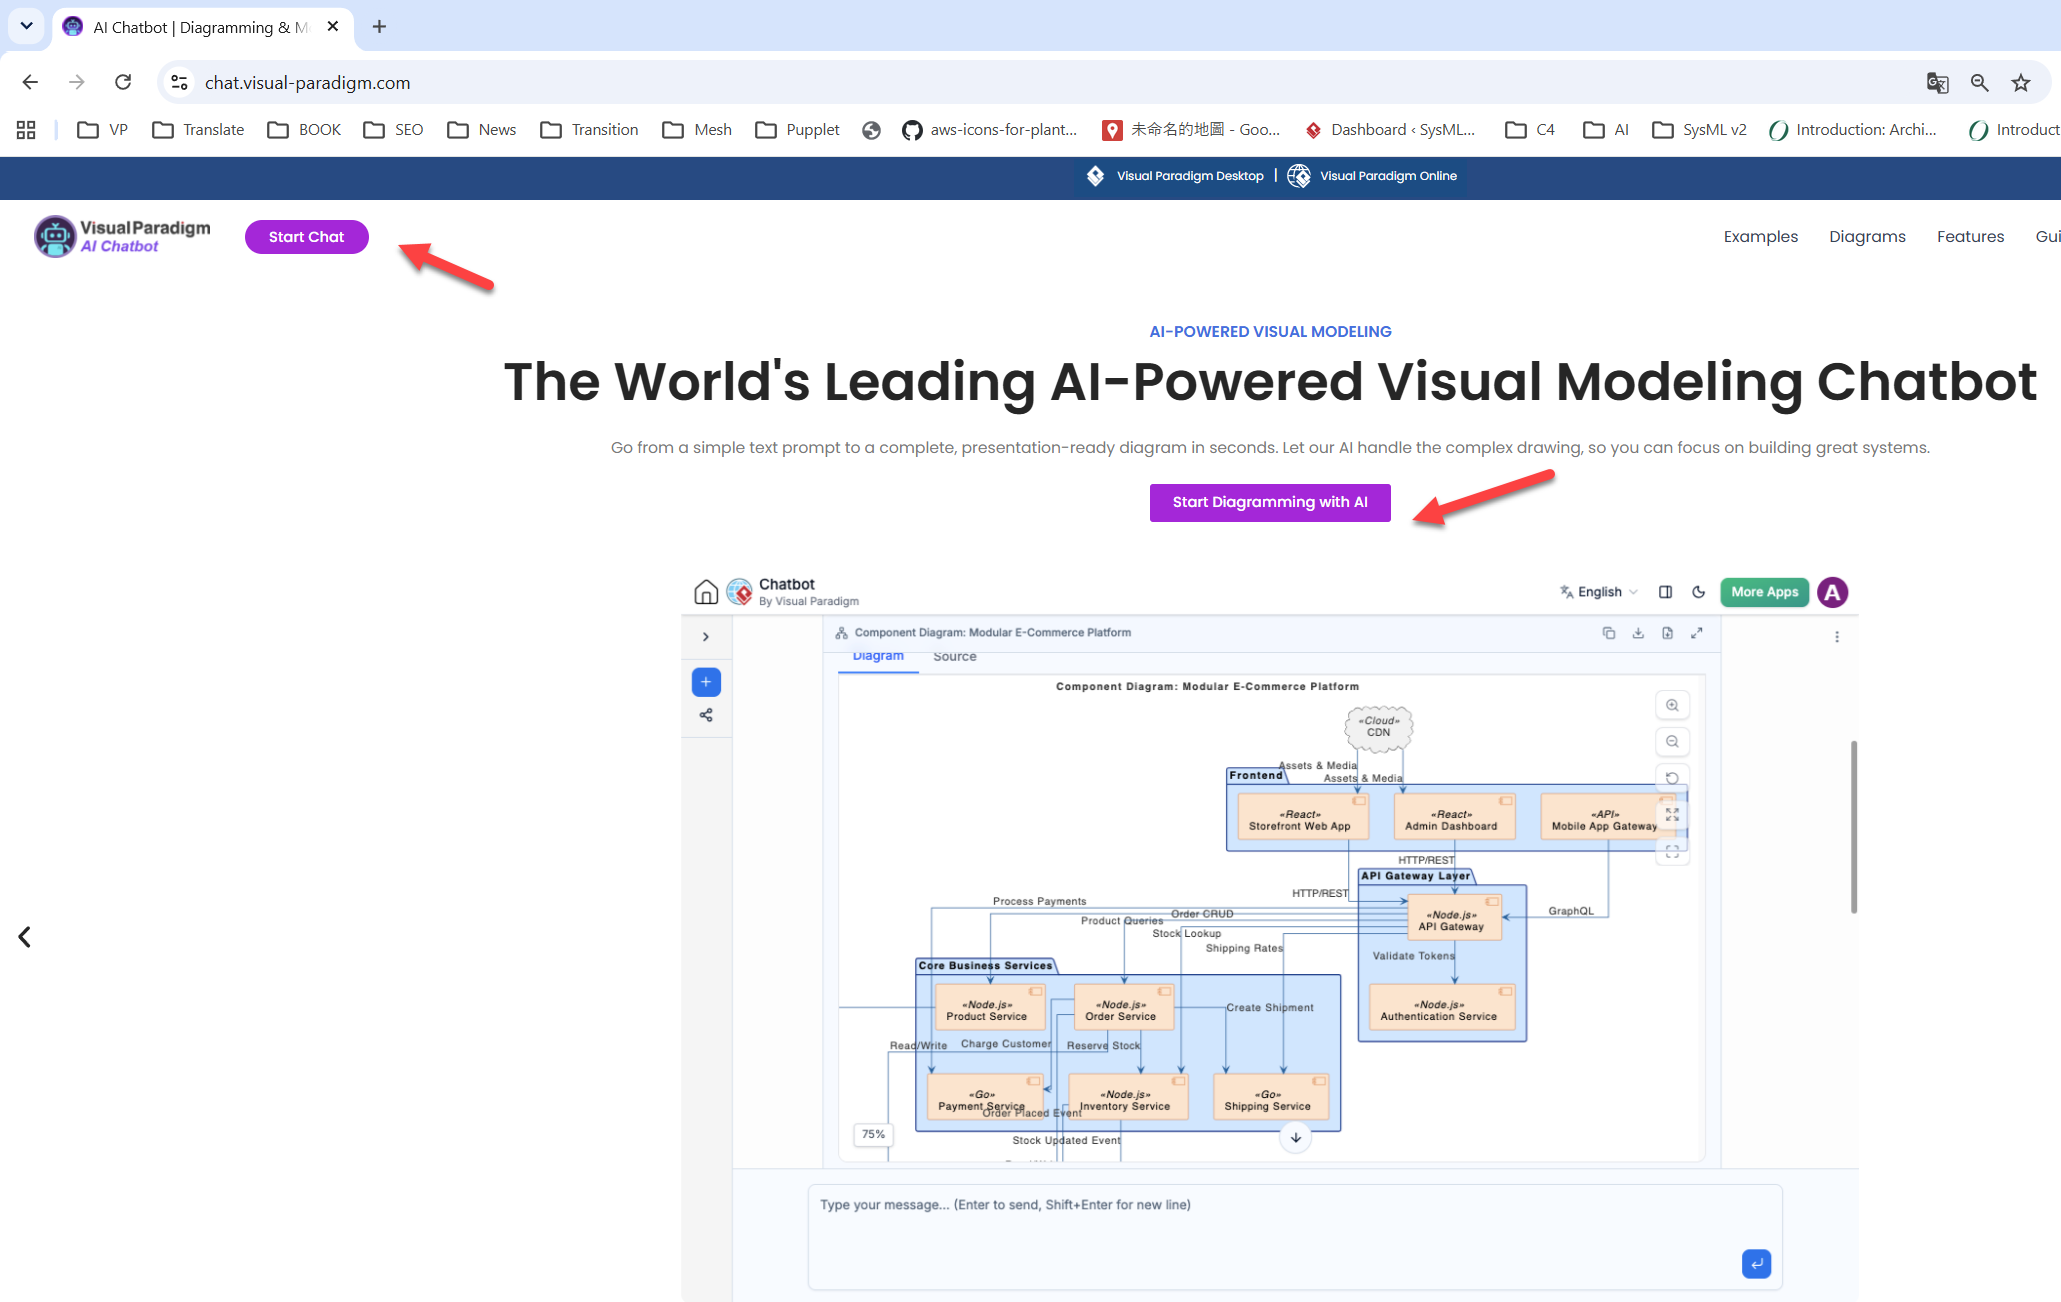
Access the VP AI Chatbot within your project. You can verify capabilities by asking, “What Diagram Can you Create?”
Step 2: Generating the Level 1 Foundation
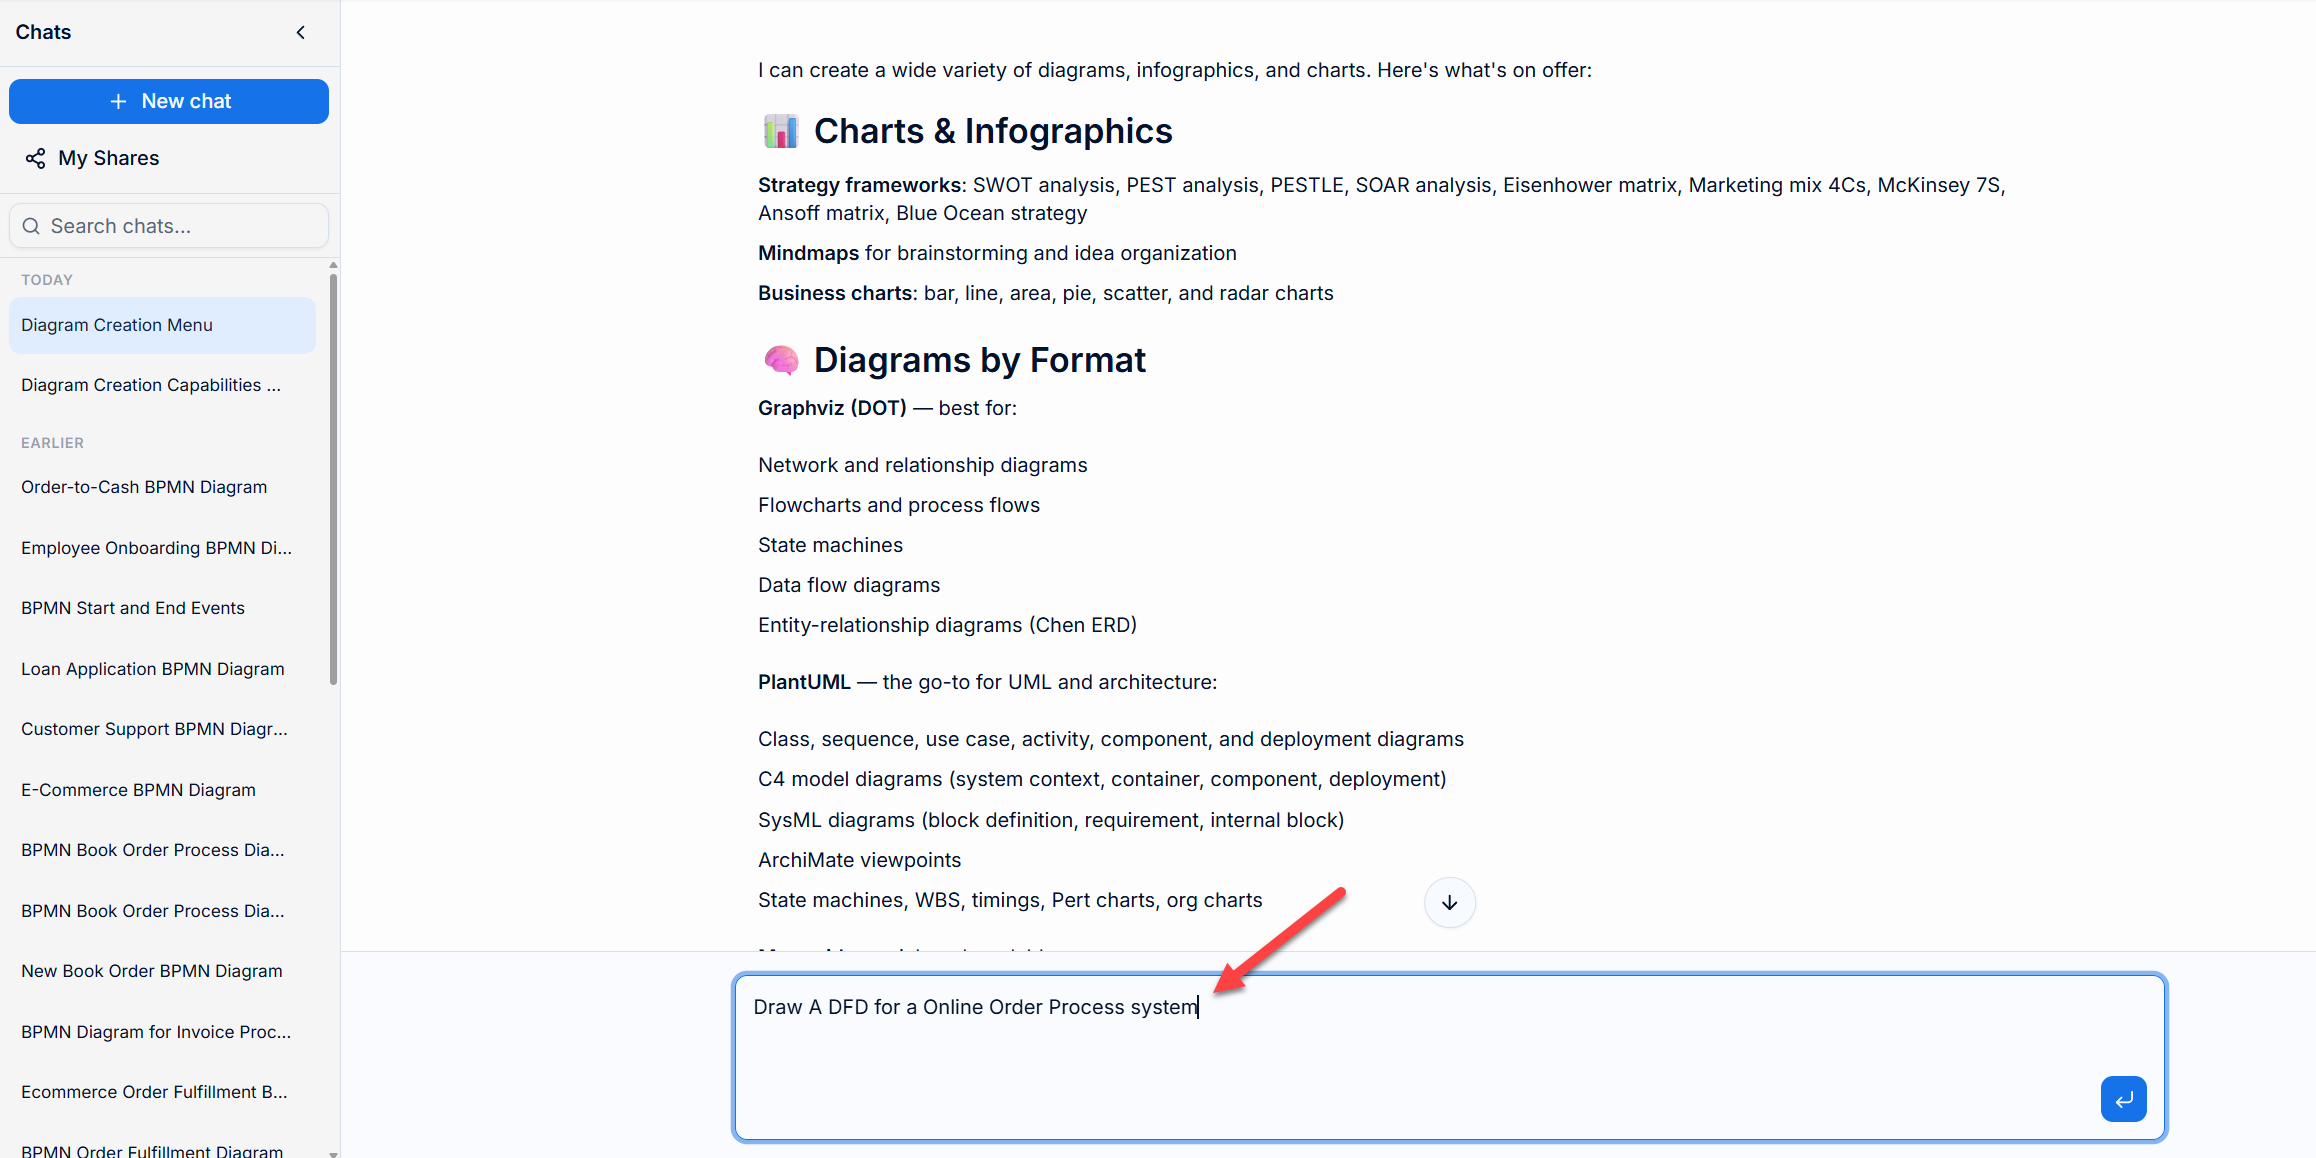
Start with a broad prompt to establish the system boundary, external entities, and major processes.
Prompt: “Draw A DFD for a Online Order Process system”
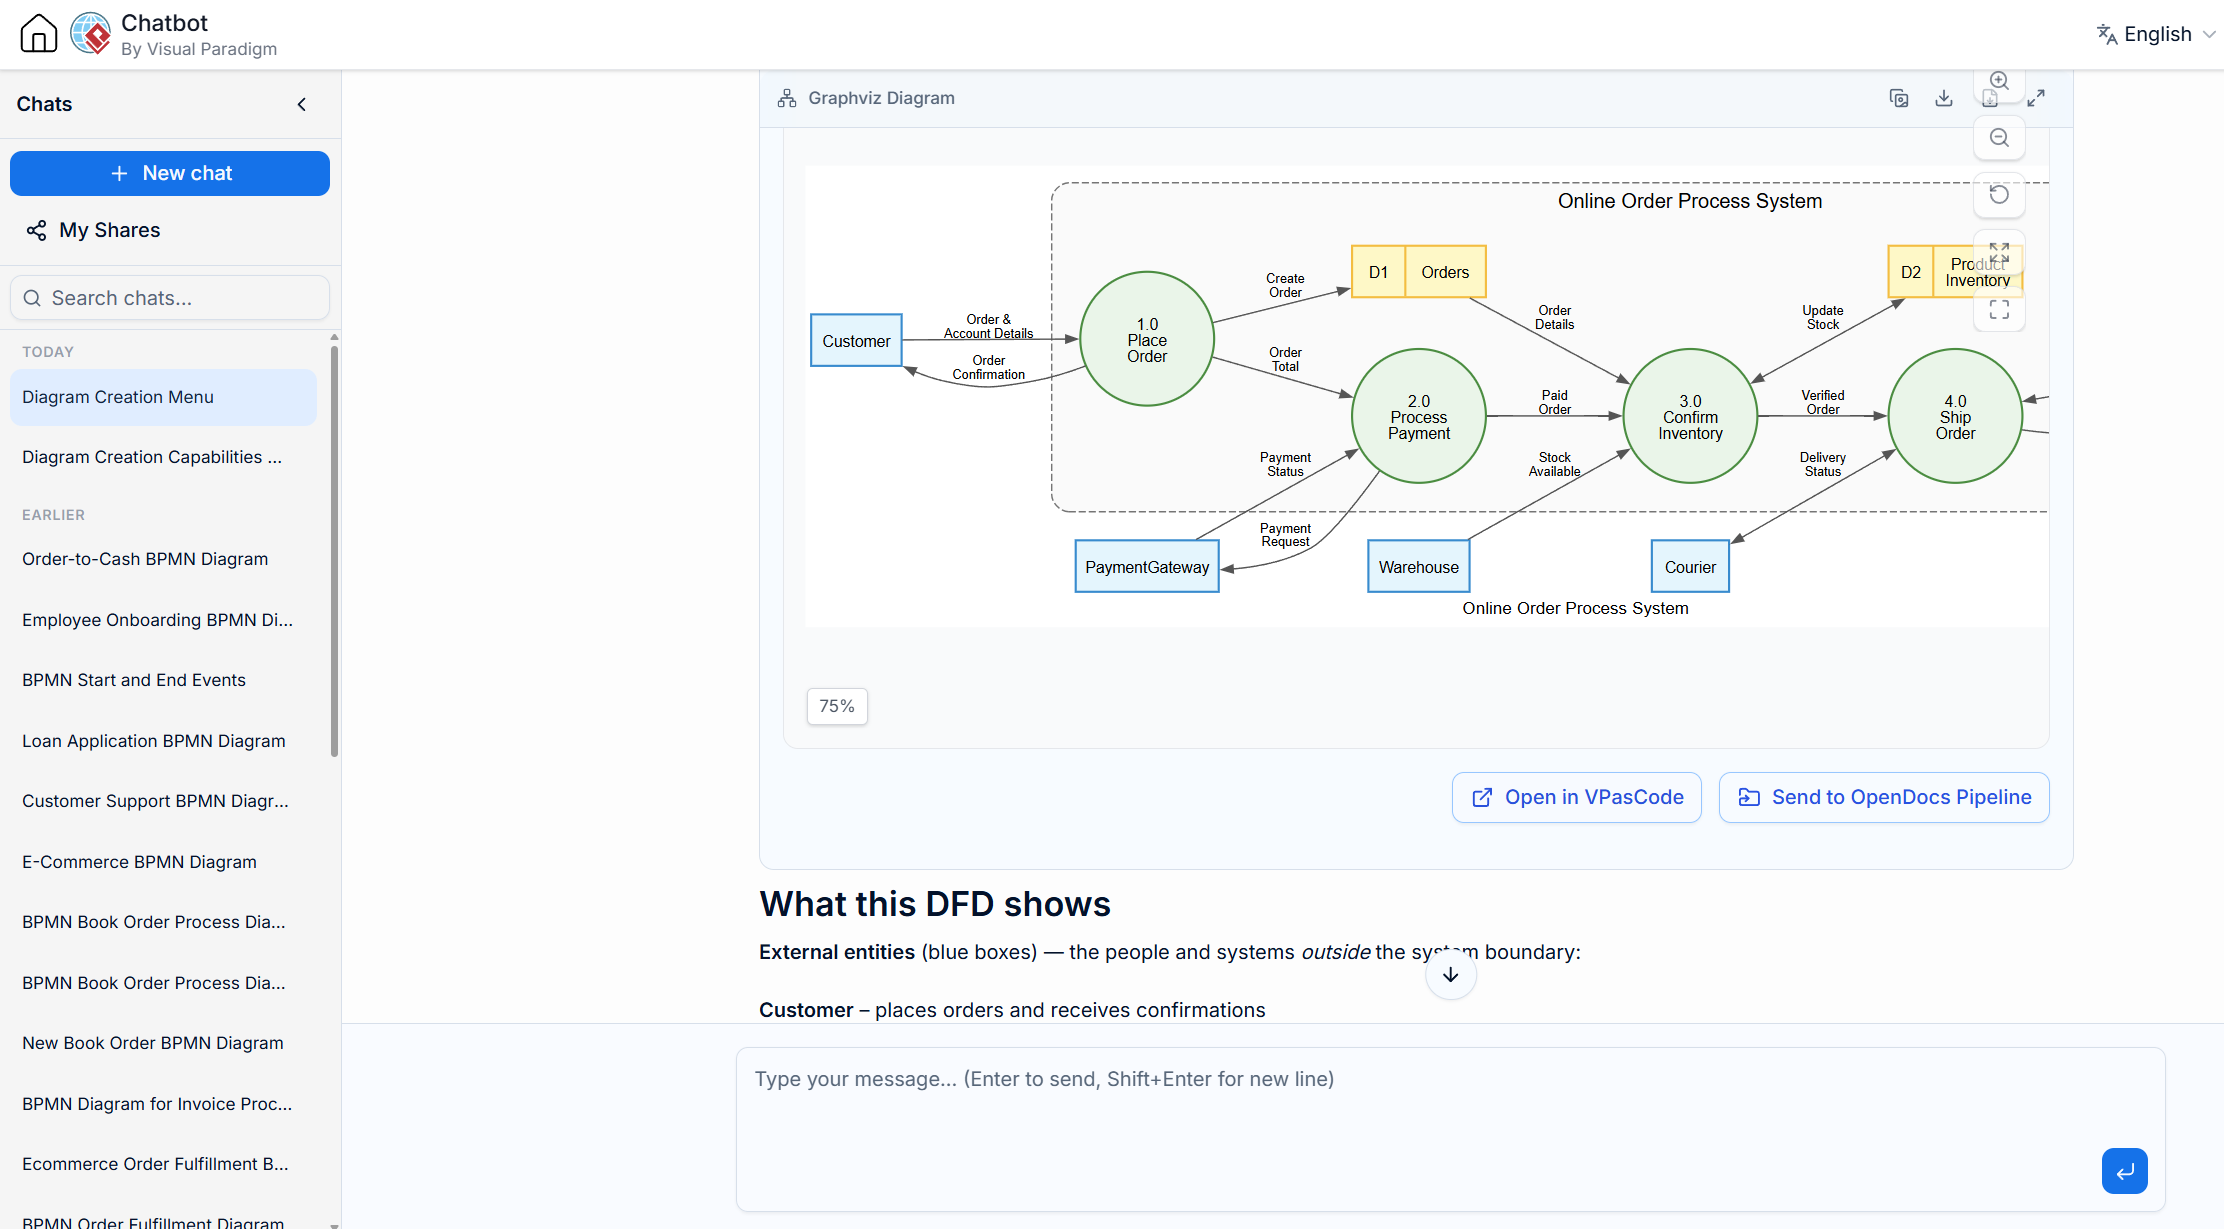
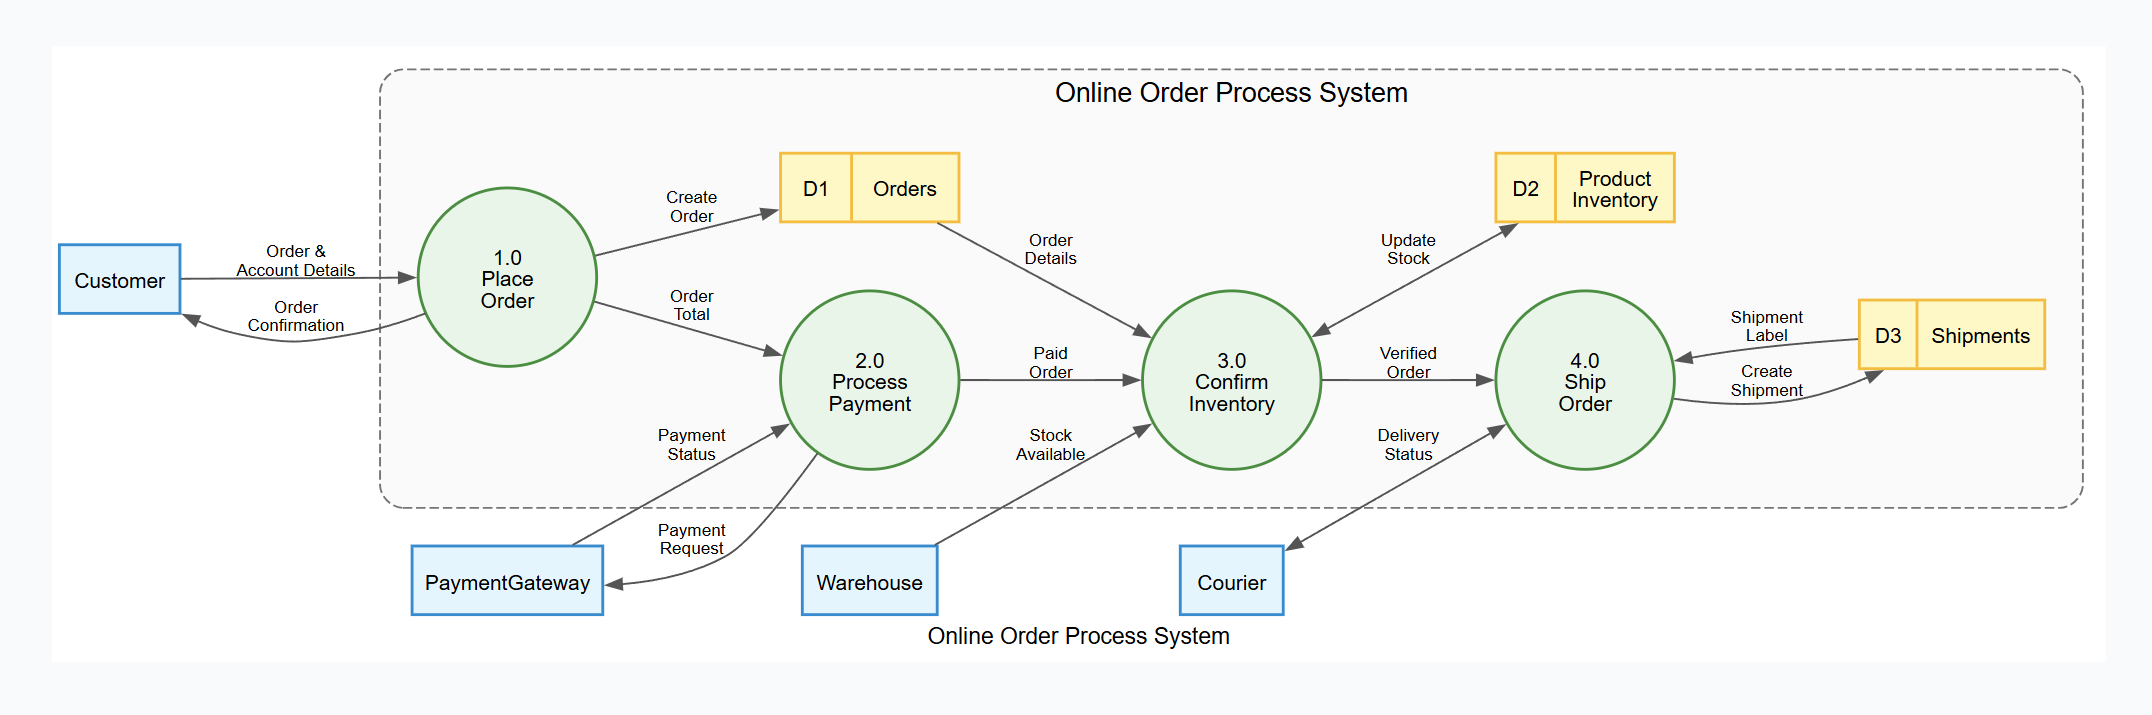
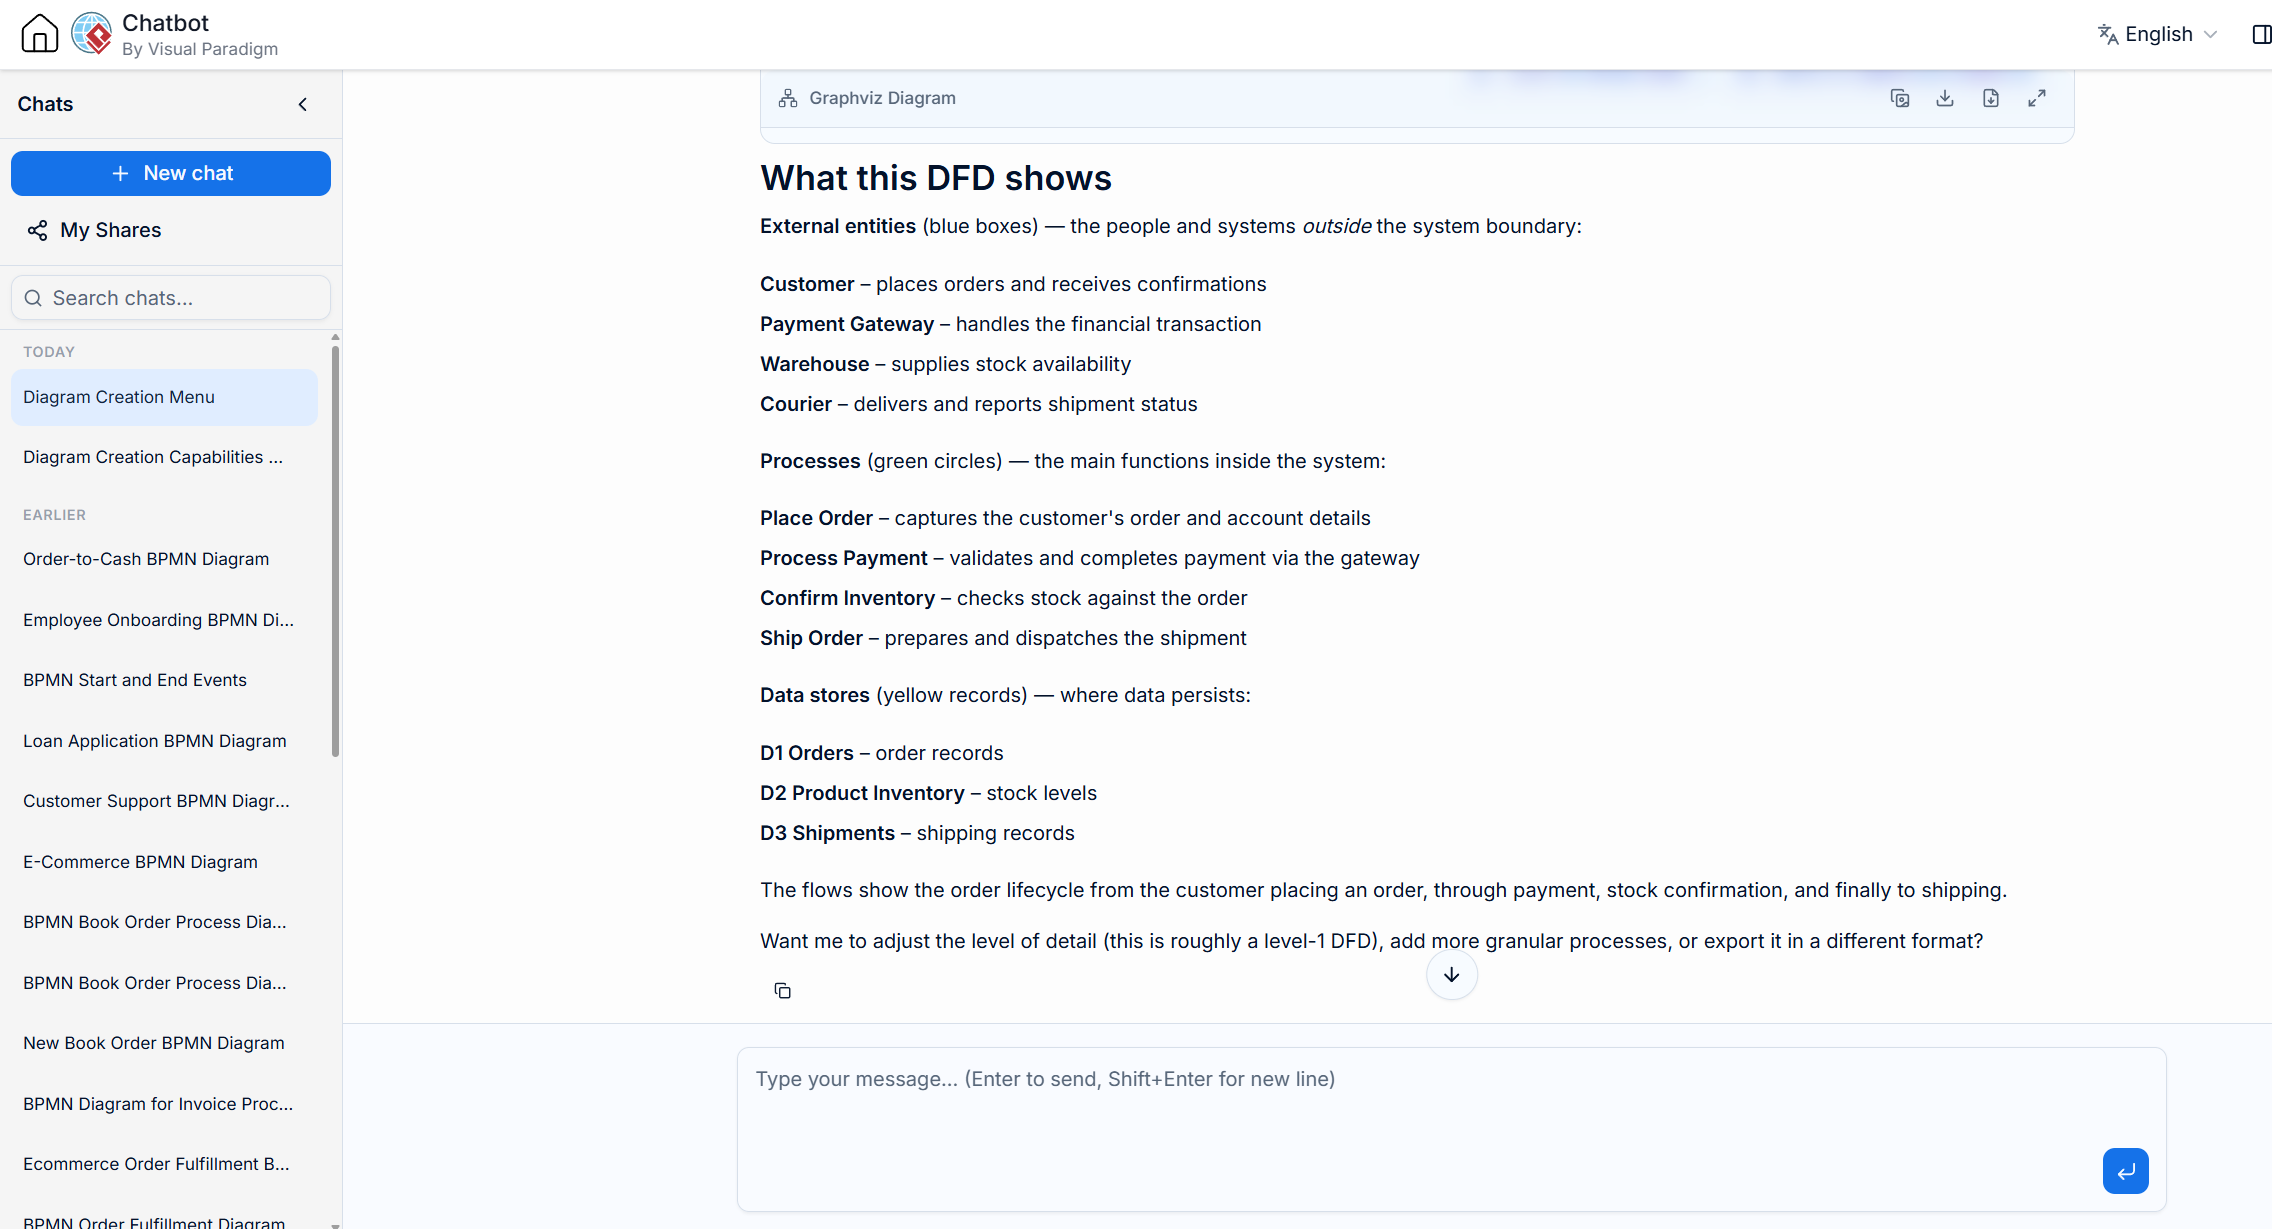
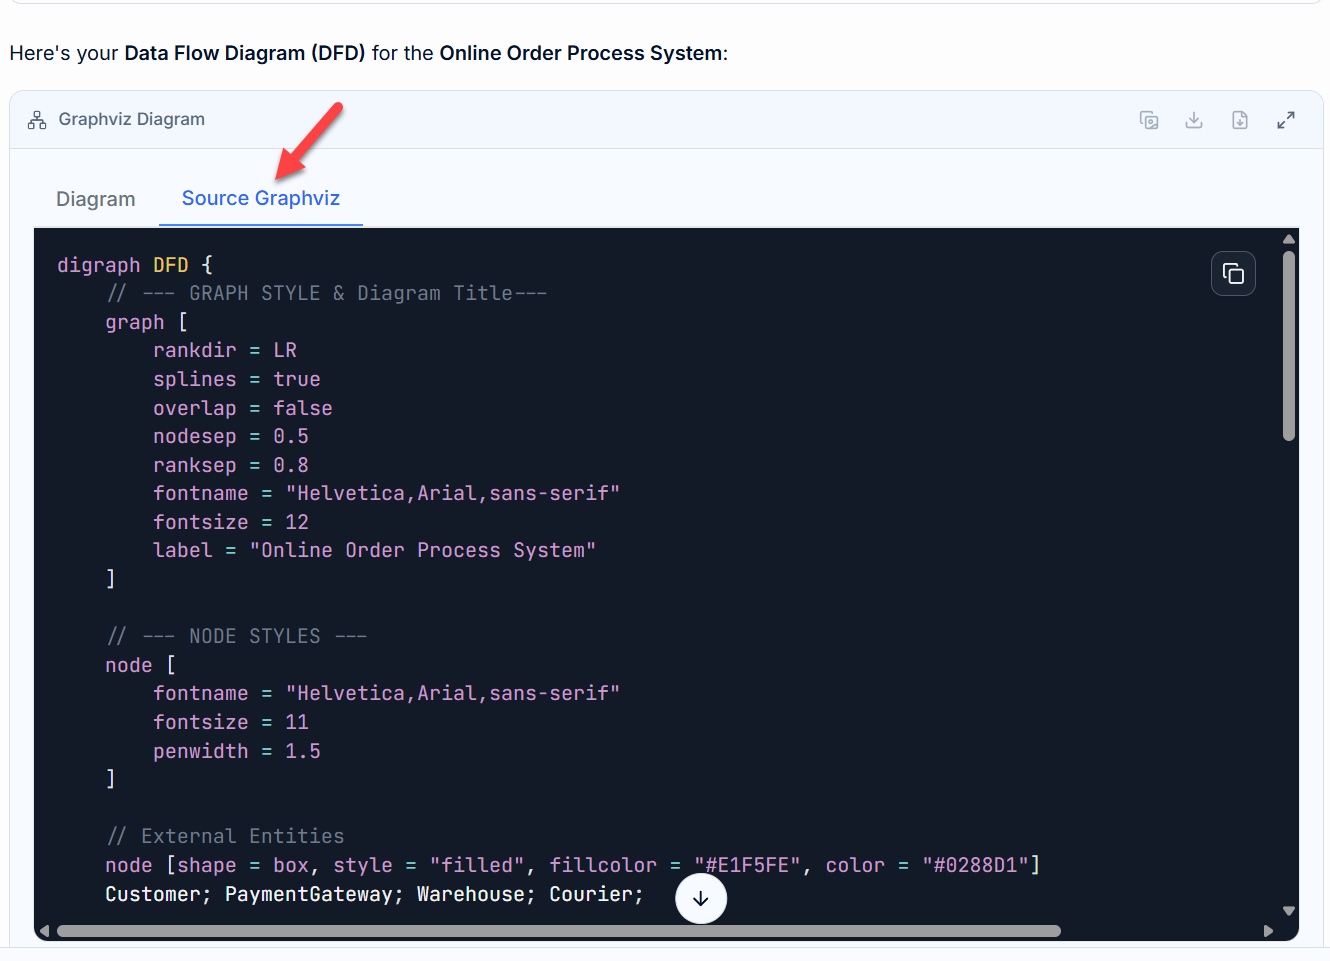
Under the Hood: The AI generates Graphviz Dot Code to render the diagram precisely. This “Diagram as Code” approach allows for easy versioning and programmatic adjustments.
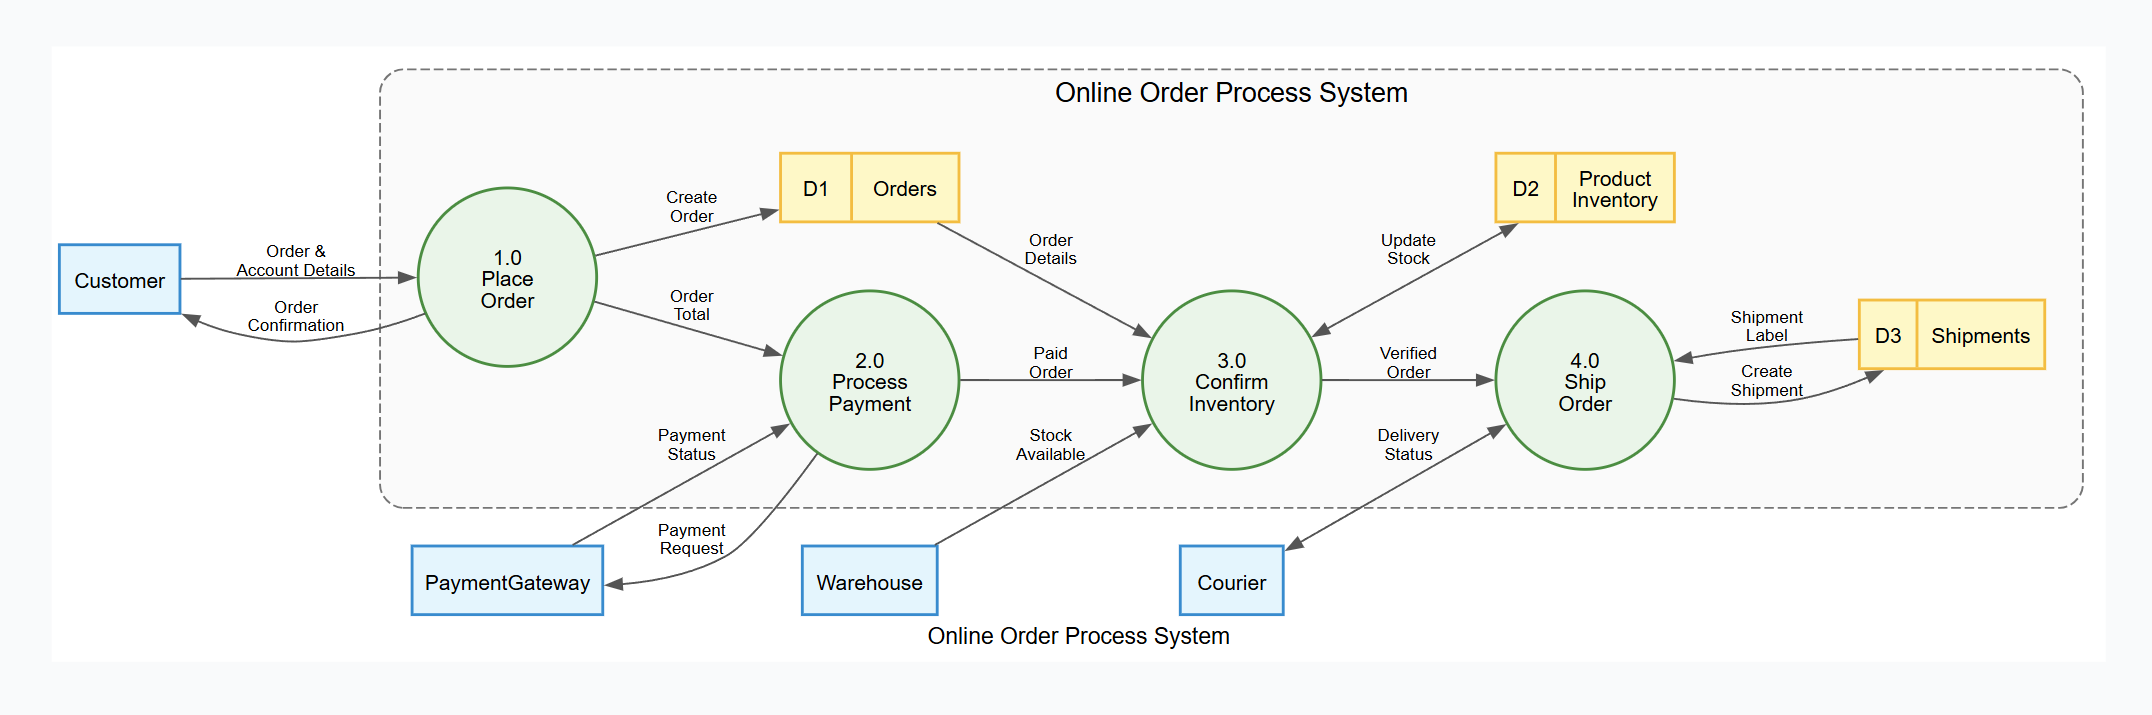
digraph DFD {
    // --- GRAPH STYLE & Diagram Title---
    graph [
        rankdir = LR
        splines = true
        overlap = false
        nodesep = 0.5
        ranksep = 0.8
        fontname = "Helvetica,Arial,sans-serif"
        fontsize = 12
        label = "Online Order Process System"
    ]

    // --- NODE STYLES ---
    node [
        fontname = "Helvetica,Arial,sans-serif"
        fontsize = 11
        penwidth = 1.5
    ]

    // External Entities
    node [shape = box, style = "filled", fillcolor = "#E1F5FE", color = "#0288D1"]
    Customer; PaymentGateway; Warehouse; Courier;

    // --- SYSTEM BOUNDARY CONTAINER ---
    subgraph cluster_SystemBoundary {
        label = "Online Order Process System";
        fontname = "Helvetica,Arial,sans-serif"
        fontsize = 14
        color = "#757575"
        style = "dashed,rounded"
        bgcolor = "#FAFAFA"
        margin = 20

        // Processes
        node [shape = circle, style = "filled", fillcolor = "#E8F5E9", color = "#388E3C", fixedsize = true, width = 1.3]
        P1 [label="1.0\nPlace\nOrder"];
        P2 [label="2.0\nProcess\nPayment"];
        P3 [label="3.0\nConfirm\nInventory"];
        P4 [label="4.0\nShip\nOrder"];

        // Data Stores
        node [shape = record, style = "filled", fillcolor = "#FFF9C4", color = "#FBC02D", fixedsize = false]
        OrderDS [label="{ <id> D1 | Orders }"];
        ProductDS [label="{ <id> D2 | Product\nInventory }"];
        ShippingDS [label="{ <id> D3 | Shipments }"];
    }

    // --- EDGE STYLES ---
    edge [
        fontname = "Helvetica,Arial,sans-serif"
        fontsize = 9
        color = "#555555"
        arrowsize = 0.8
    ]

    // --- DATA FLOWS ---
    // Customer interactions
    Customer -> P1 [label="Order &\nAccount Details"];
    P1 -> Customer [label="Order\nConfirmation"];
    P2 -> PaymentGateway [label="Payment\nRequest"];
    PaymentGateway -> P2 [label="Payment\nStatus"];

    // Process to Process
    P1 -> P2 [label="Order\nTotal"];
    P2 -> P3 [label="Paid\nOrder"];
    P3 -> P4 [label="Verified\nOrder"];

    // Process to Data Store
    P1 -> OrderDS [label="Create\nOrder"];                       // write
    P3 -> ProductDS [label="Update\nStock", dir=both];           // read & write
    P4 -> ShippingDS [label="Create\nShipment"];                 // write

    // Data Store to Process
    OrderDS -> P3 [label="Order\nDetails"];                      // read
    ShippingDS -> P4 [label="Shipment\nLabel"];                  // read

    // Courier / Warehouse interactions
    Warehouse -> P3 [label="Stock\nAvailable"];
    Courier -> P4 [label="Delivery\nStatus", dir=both];
}
Step 3: Level 2 Decomposition via Conversation
Instead of manually drawing sub-processes, ask the AI to “zoom in.” This maintains parent-child linkage automatically.
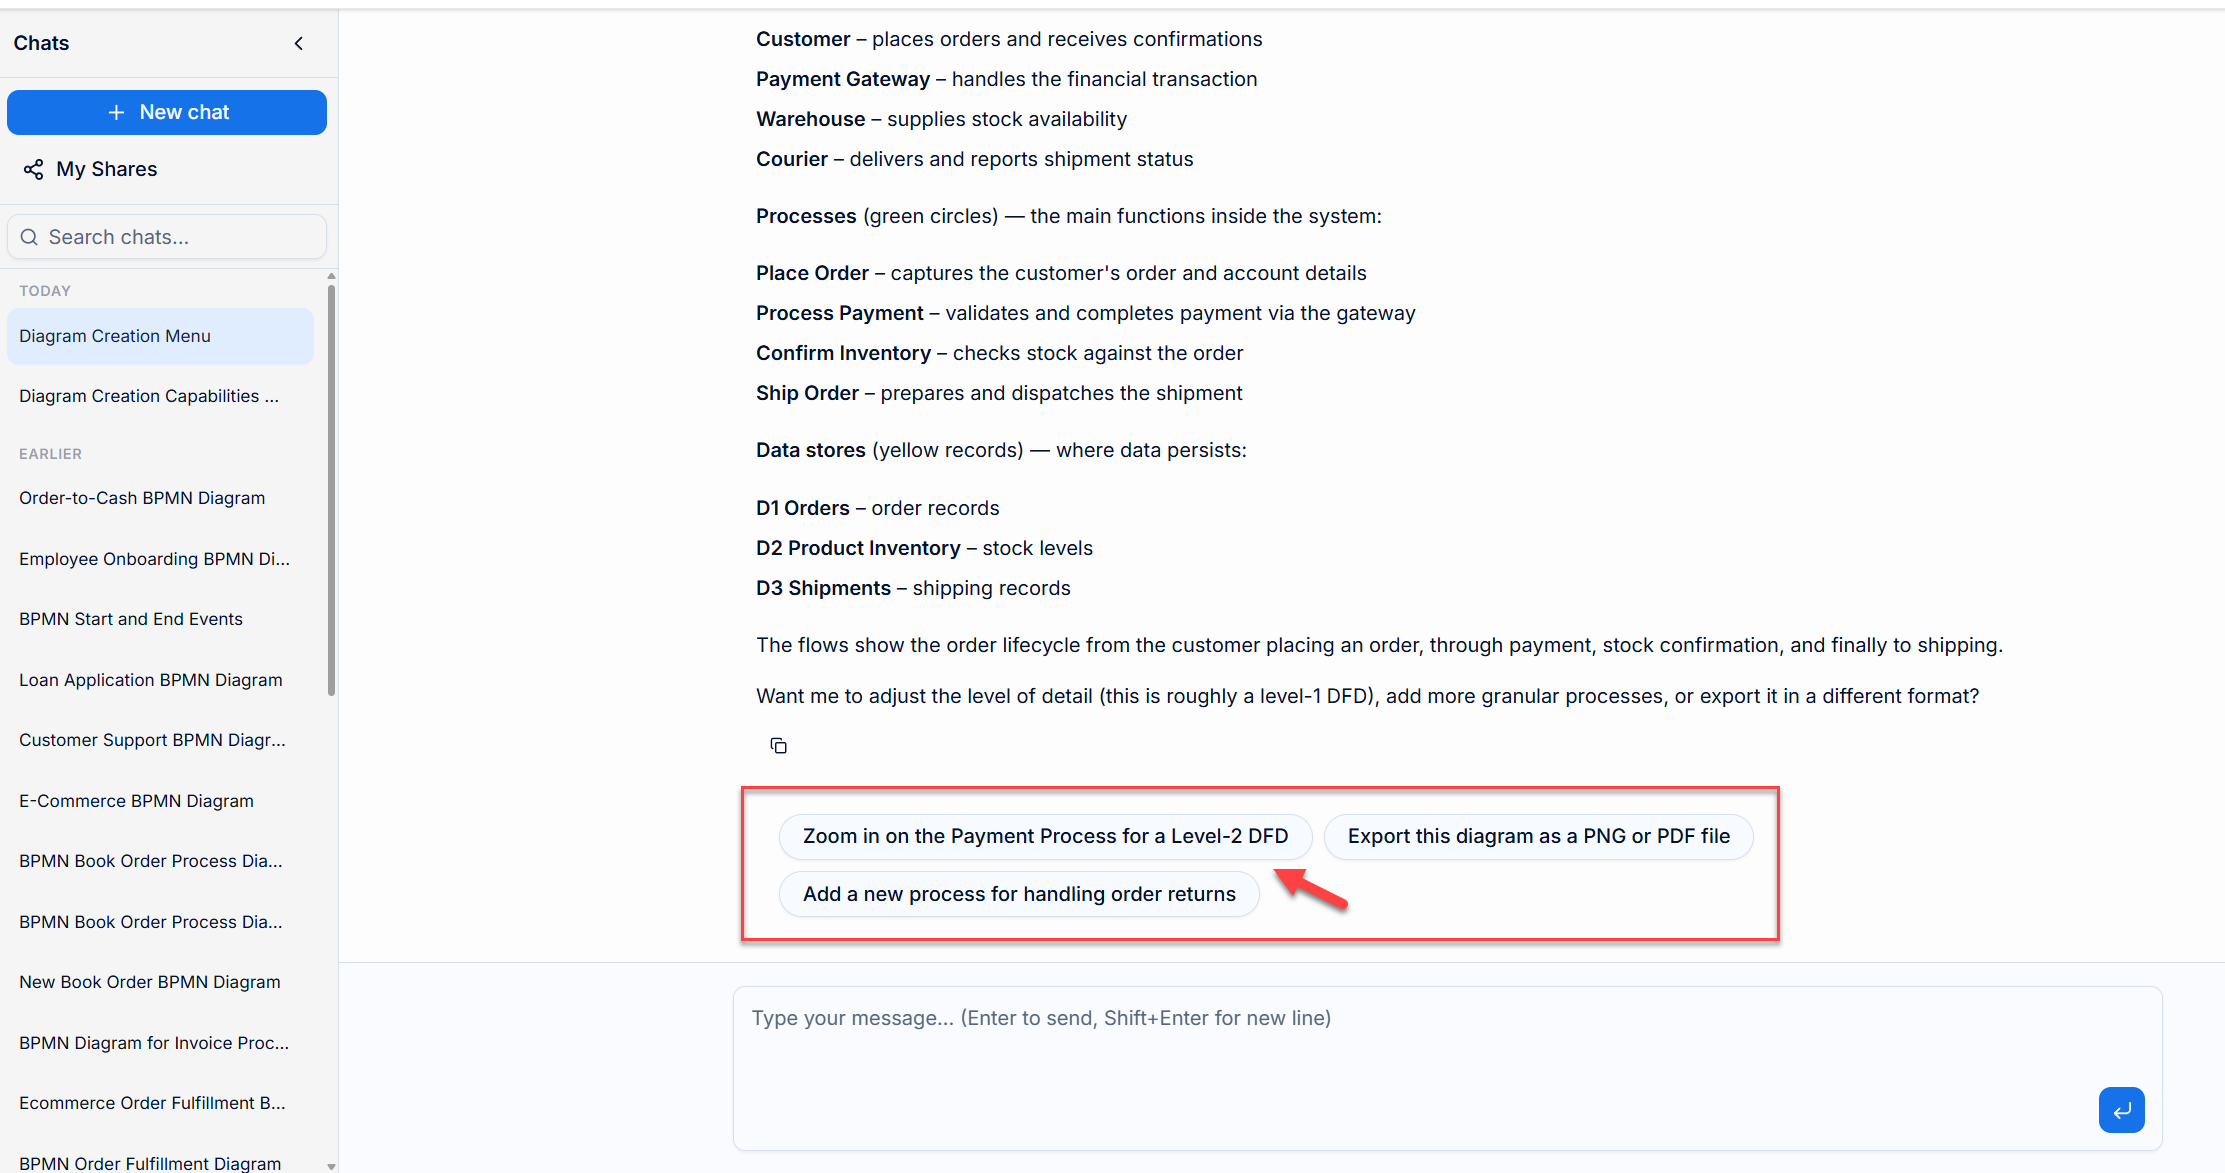
Action: Select suggestion “Zoom in on the Payment Process for a level 2 DFD”
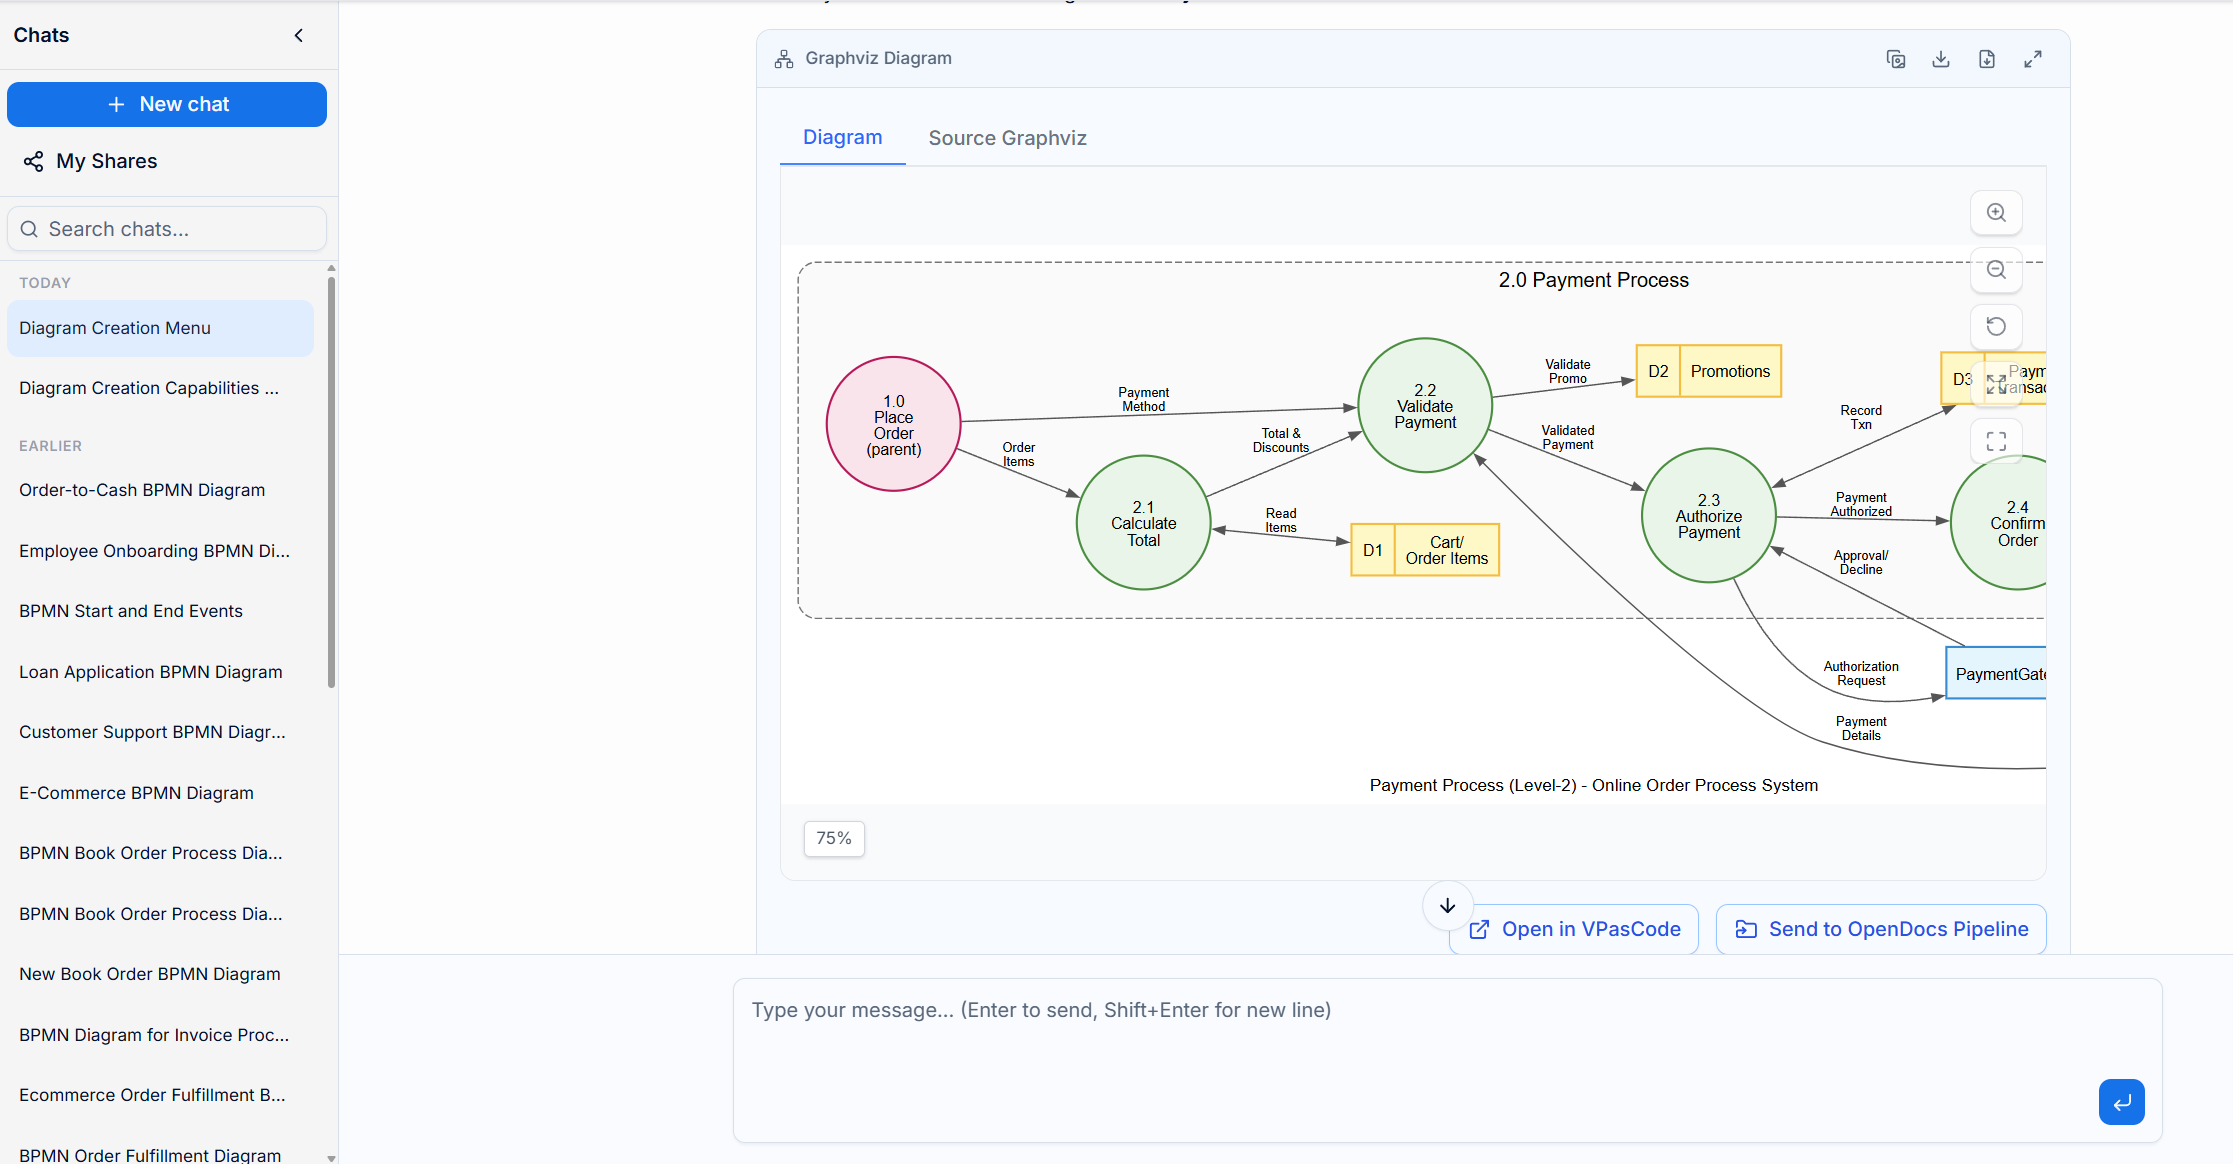
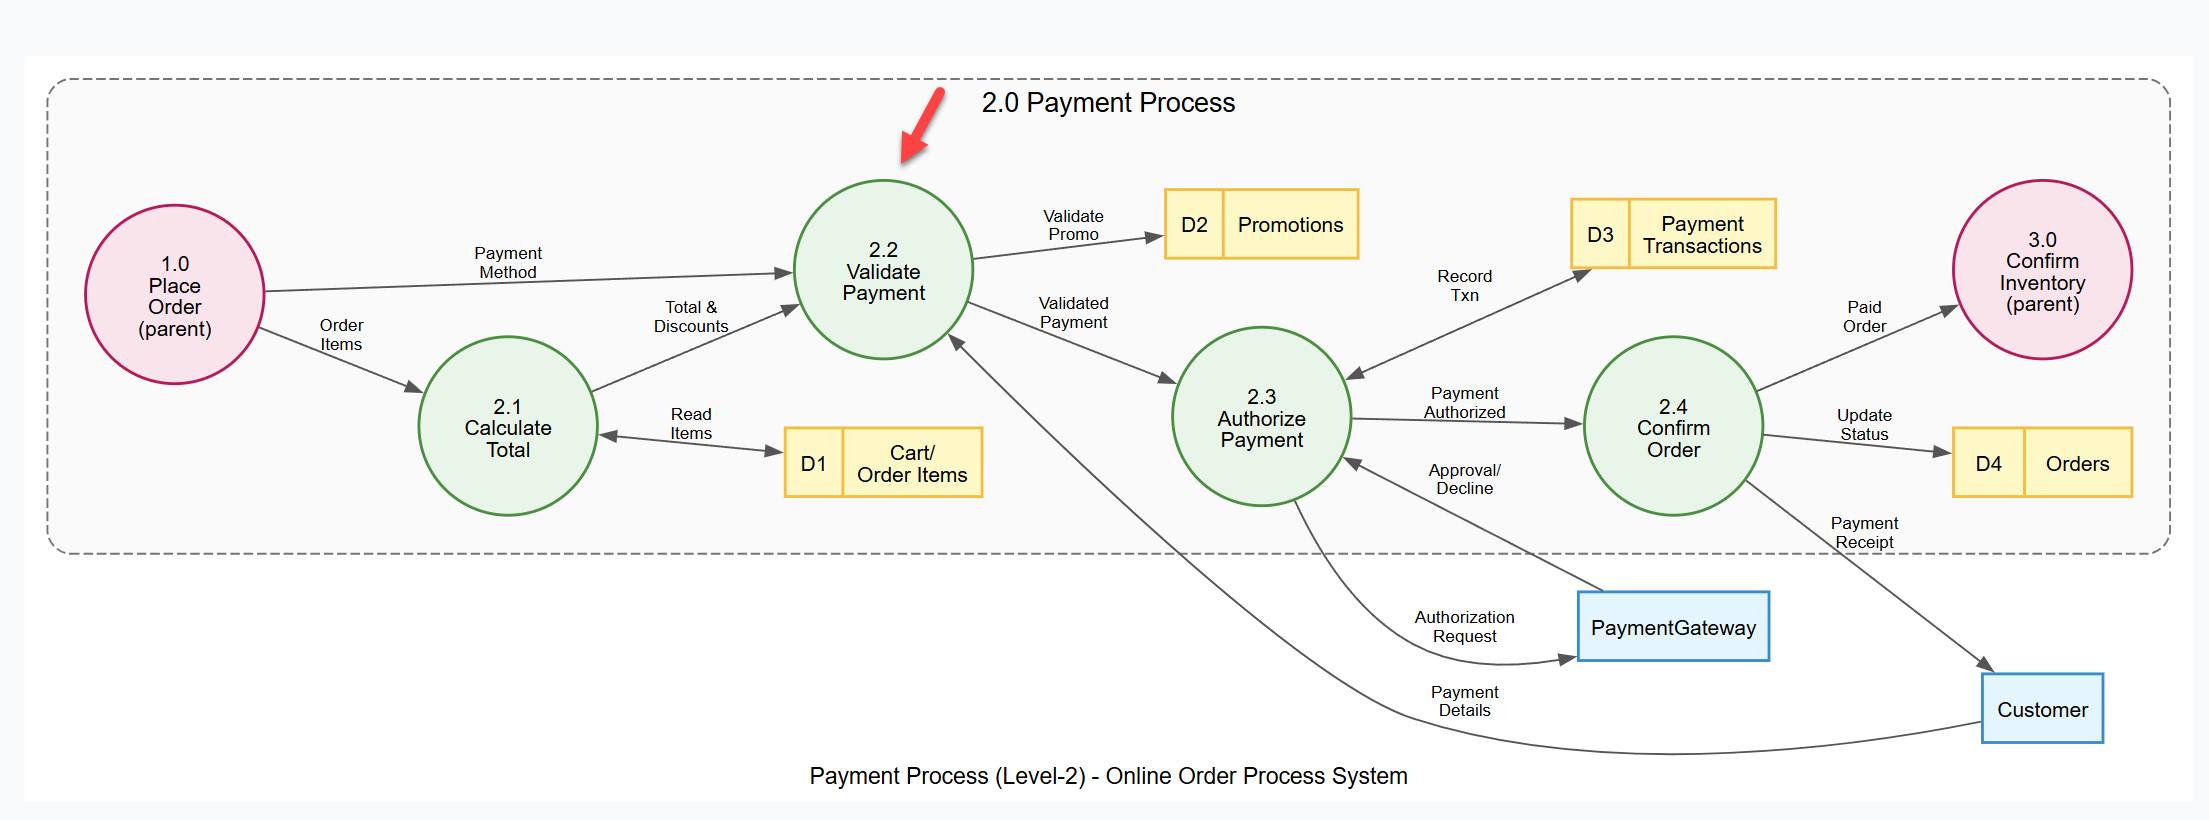
Key Observation: Note how parent processes (1.0 and 3.0) appear in pink as boundary references. This visual cue helps verify balancing at a glance.
Step 4: Level 3 Deep Dive
For complex logic like payment validation, drill down further.
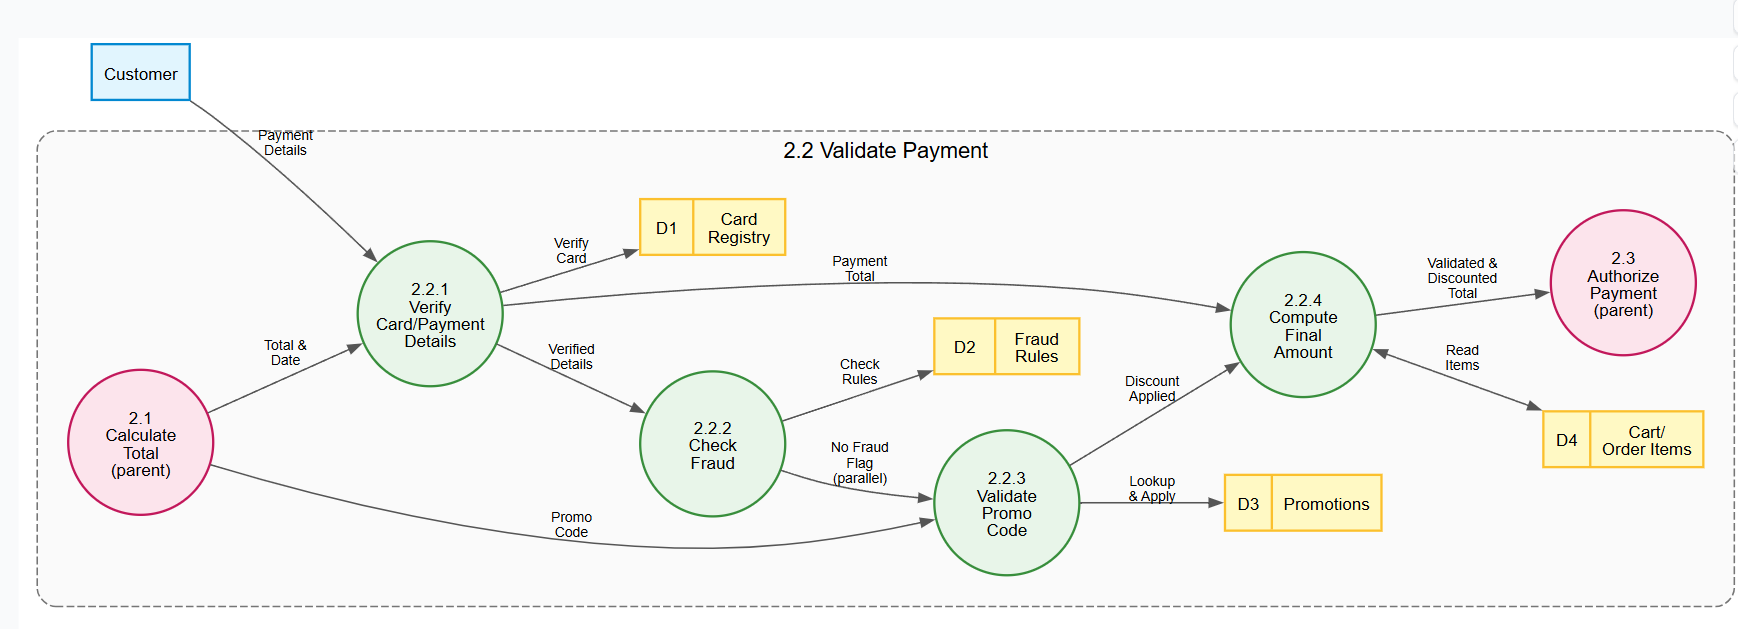
Action: Select “Break down the validate Payment sub-process further”
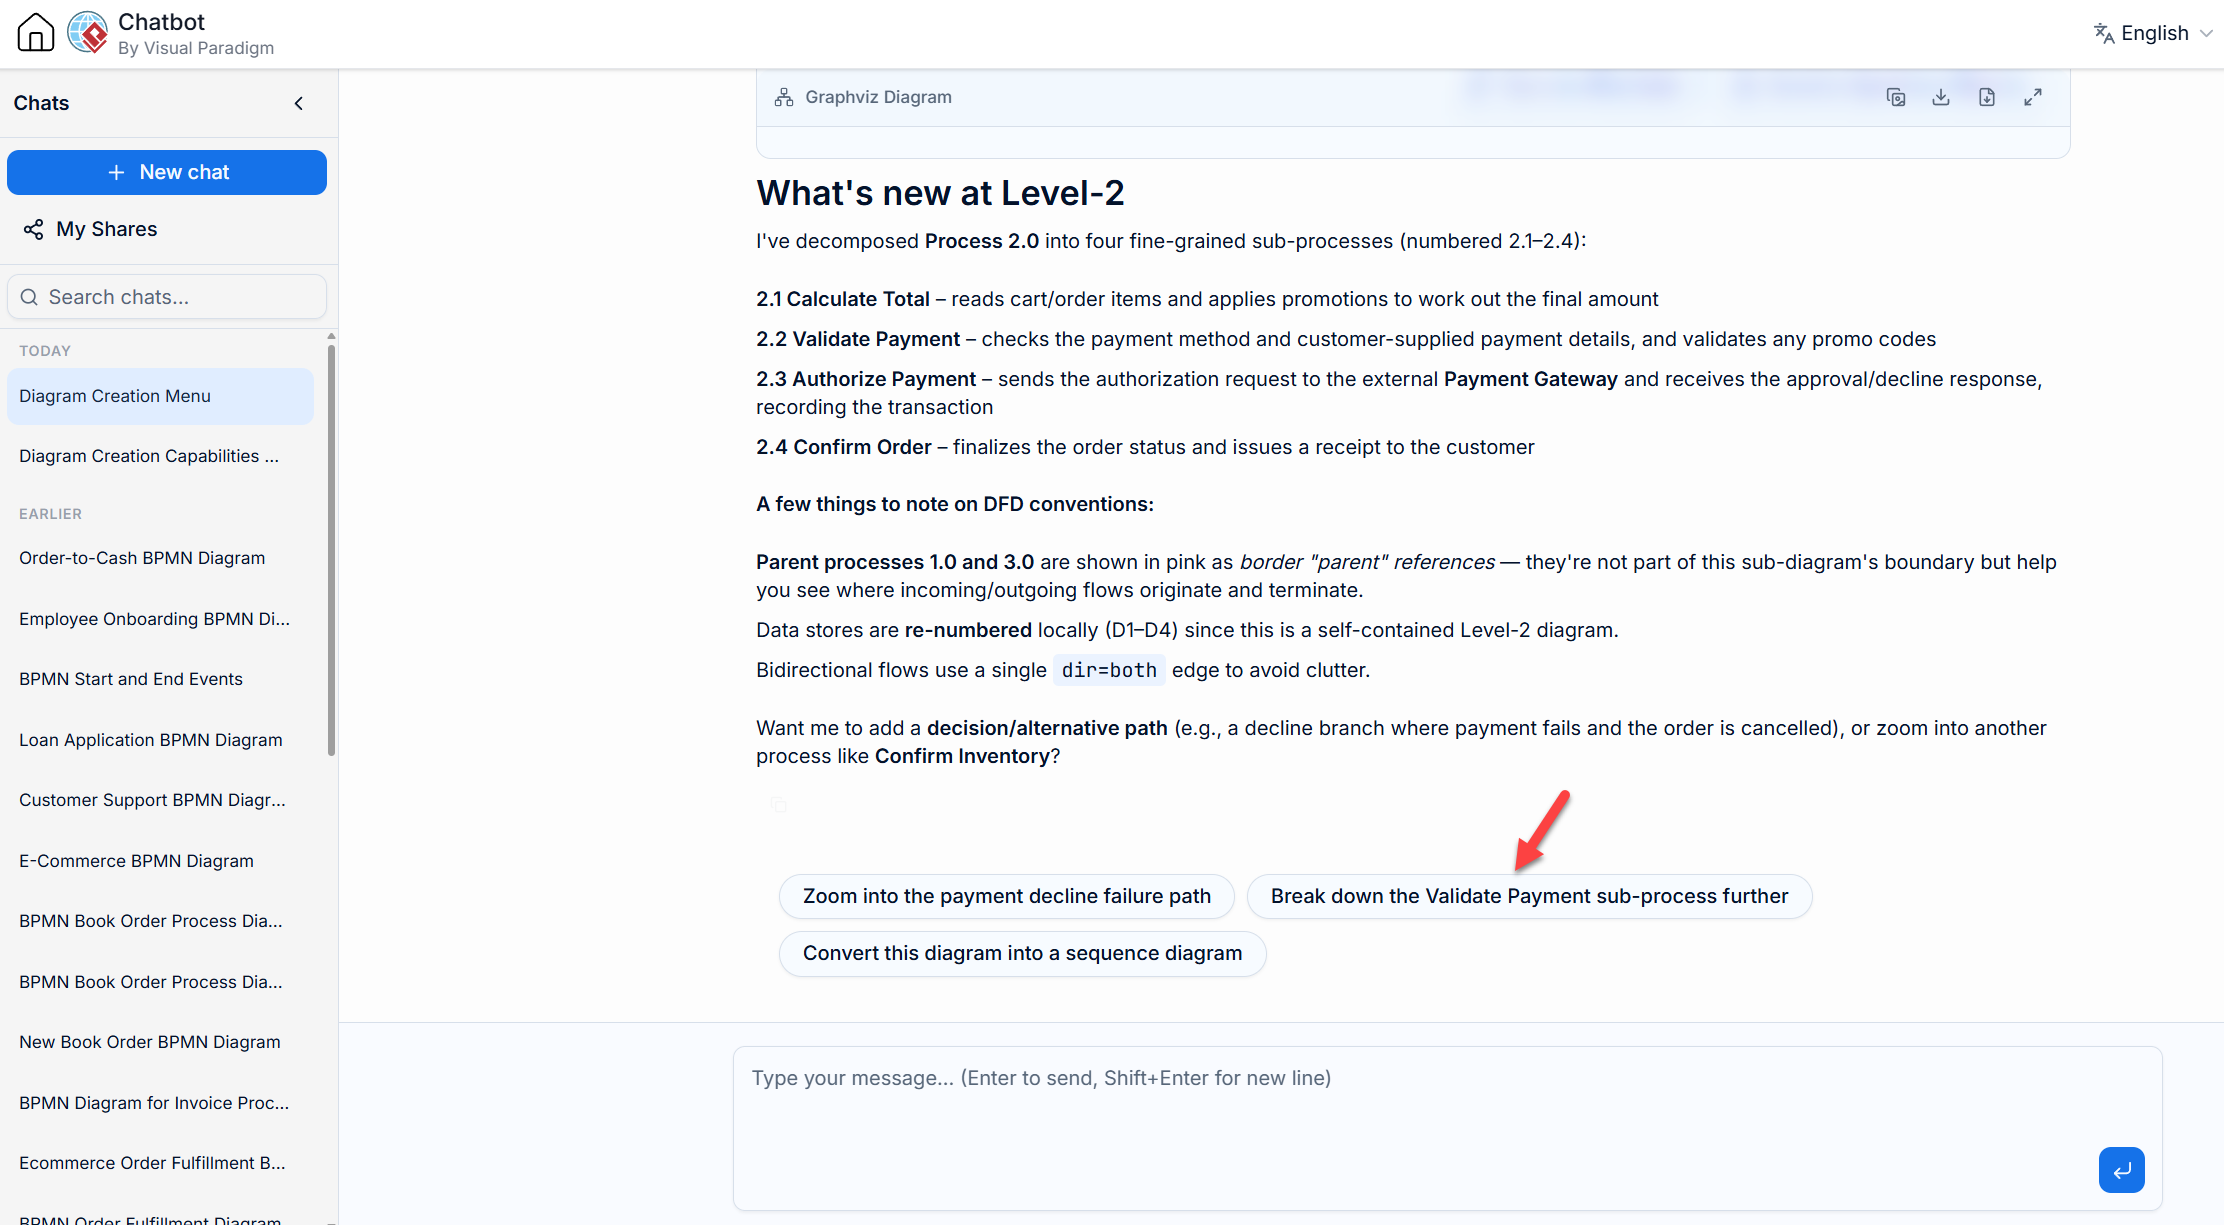
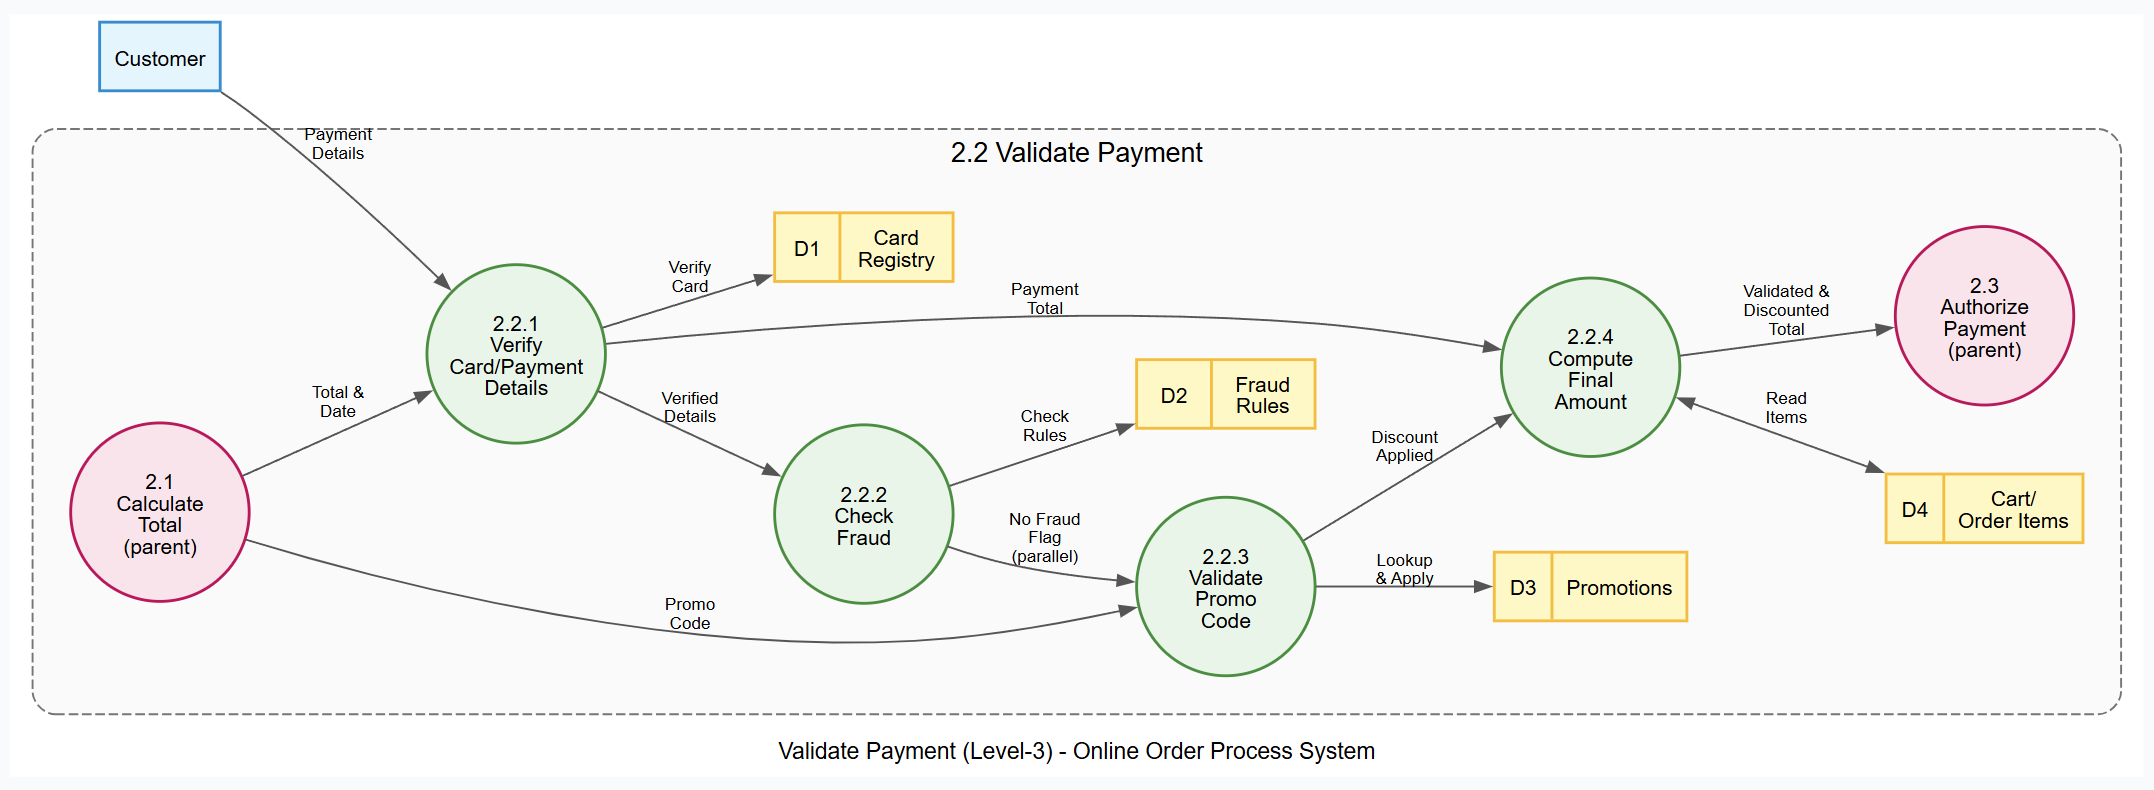
At Level 3, you see atomic tasks like “Fraud Check” and “Validate Promo Code.” The AI intelligently identifies parallel opportunities and maintains the hierarchical numbering scheme (2.2.1, 2.2.2, etc.).
Step 5: Leveraging Shared Sessions for Continuity
AI modeling is rarely linear. VP AI allows you to resume sessions or branch out without losing context.
Using shared sessions, you can jump to a different branch (e.g., Process 3.0 Confirm Inventory) while retaining all previous definitions.
Prompt: “Zoom in on the Confirm Inventory Process for a level 2 DFD”
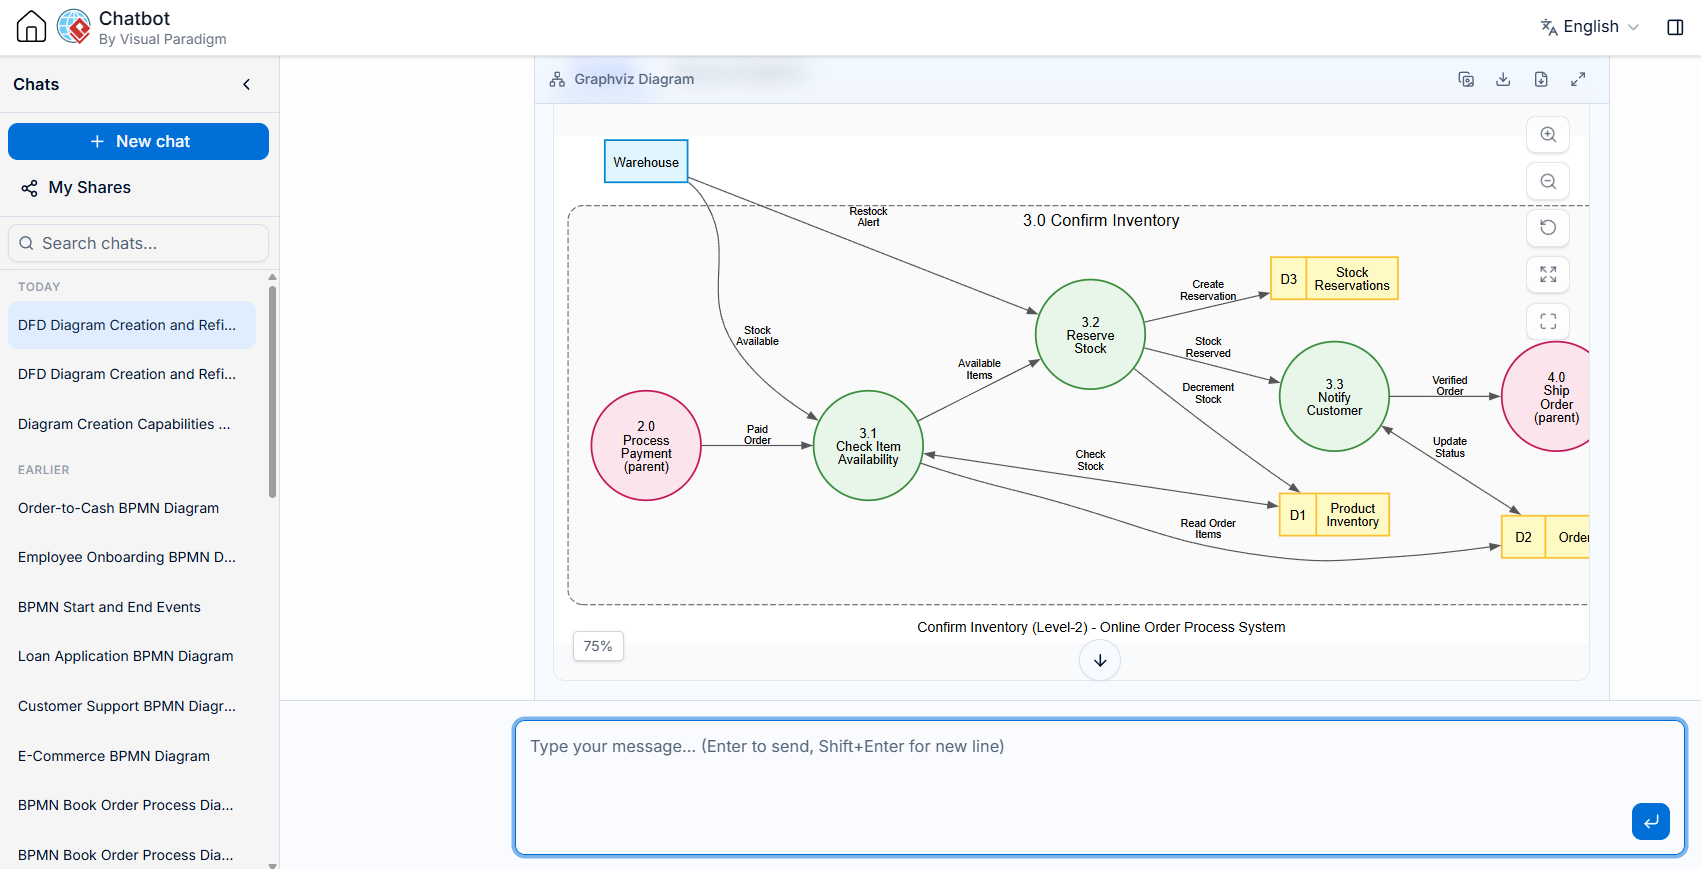
digraph DFD {
// --- GRAPH STYLE & Diagram Title---
graph [
rankdir = LR
splines = true
overlap = false
nodesep = 0.5
ranksep = 0.8
fontname = "Helvetica,Arial,sans-serif"
fontsize = 12
label = "Confirm Inventory (Level-2) - Online Order Process System"
]

// --- NODE STYLES ---
node [
fontname = "Helvetica,Arial,sans-serif"
fontsize = 11
penwidth = 1.5
]

// External Entities (parents from Level-1)
node [shape = box, style = "filled", fillcolor = "#E1F5FE", color = "#0288D1"]
Warehouse;

// --- SYSTEM BOUNDARY CONTAINER ---
subgraph cluster_SystemBoundary {
label = "3.0 Confirm Inventory";
fontname = "Helvetica,Arial,sans-serif"
fontsize = 14
color = "#757575"
style = "dashed,rounded"
bgcolor = "#FAFAFA"
margin = 20

// Sub-processes
node [shape = circle, style = "filled", fillcolor = "#E8F5E9", color = "#388E3C", fixedsize = true, width = 1.3]
P31 [label="3.1\nCheck Item\nAvailability"];
P32 [label="3.2\nReserve\nStock"];
P33 [label="3.3\nNotify\nCustomer"];

// Data Stores
node [shape = record, style = "filled", fillcolor = "#FFF9C4", color = "#FBC02D", fixedsize = false]
ProductDS [label="{ <id> D1 | Product\nInventory }"];
OrderDS [label="{ <id> D2 | Orders }"];
ReservationDS [label="{ <id> D3 | Stock\nReservations }"];

// Parent processes (from Level-1/Level-2)
node [shape = circle, style = "filled", fillcolor = "#FCE4EC", color = "#C2185B", fixedsize = true, width = 1.3]
P2 [label="2.0\nProcess\nPayment\n(parent)"];
P4 [label="4.0\nShip\nOrder\n(parent)"];
}

// --- EDGE STYLES ---
edge [
fontname = "Helvetica,Arial,sans-serif"
fontsize = 9
color = "#555555"
arrowsize = 0.8
]

// --- DATA FLOWS ---
// Parent process input
P2 -> P31 [label="Paid\nOrder"];

// Sub-process chain
P31 -> P32 [label="Available\nItems"];
P32 -> P33 [label="Stock\nReserved"];

// Flows to parent process
P33 -> P4 [label="Verified\nOrder"];

// Data store accesses
P31 -> OrderDS [label="Read Order\nItems"];
P31 -> ProductDS [label="Check\nStock", dir=both];
P32 -> ProductDS [label="Decrement\nStock"];
P32 -> ReservationDS [label="Create\nReservation"];
P33 -> OrderDS [label="Update\nStatus", dir=both];

// Warehouse interaction (external entity)
Warehouse -> P31 [label="Stock\nAvailable"];
Warehouse -> P32 [label="Restock\nAlert"];
}
Step 6: Collaboration Through Sharing
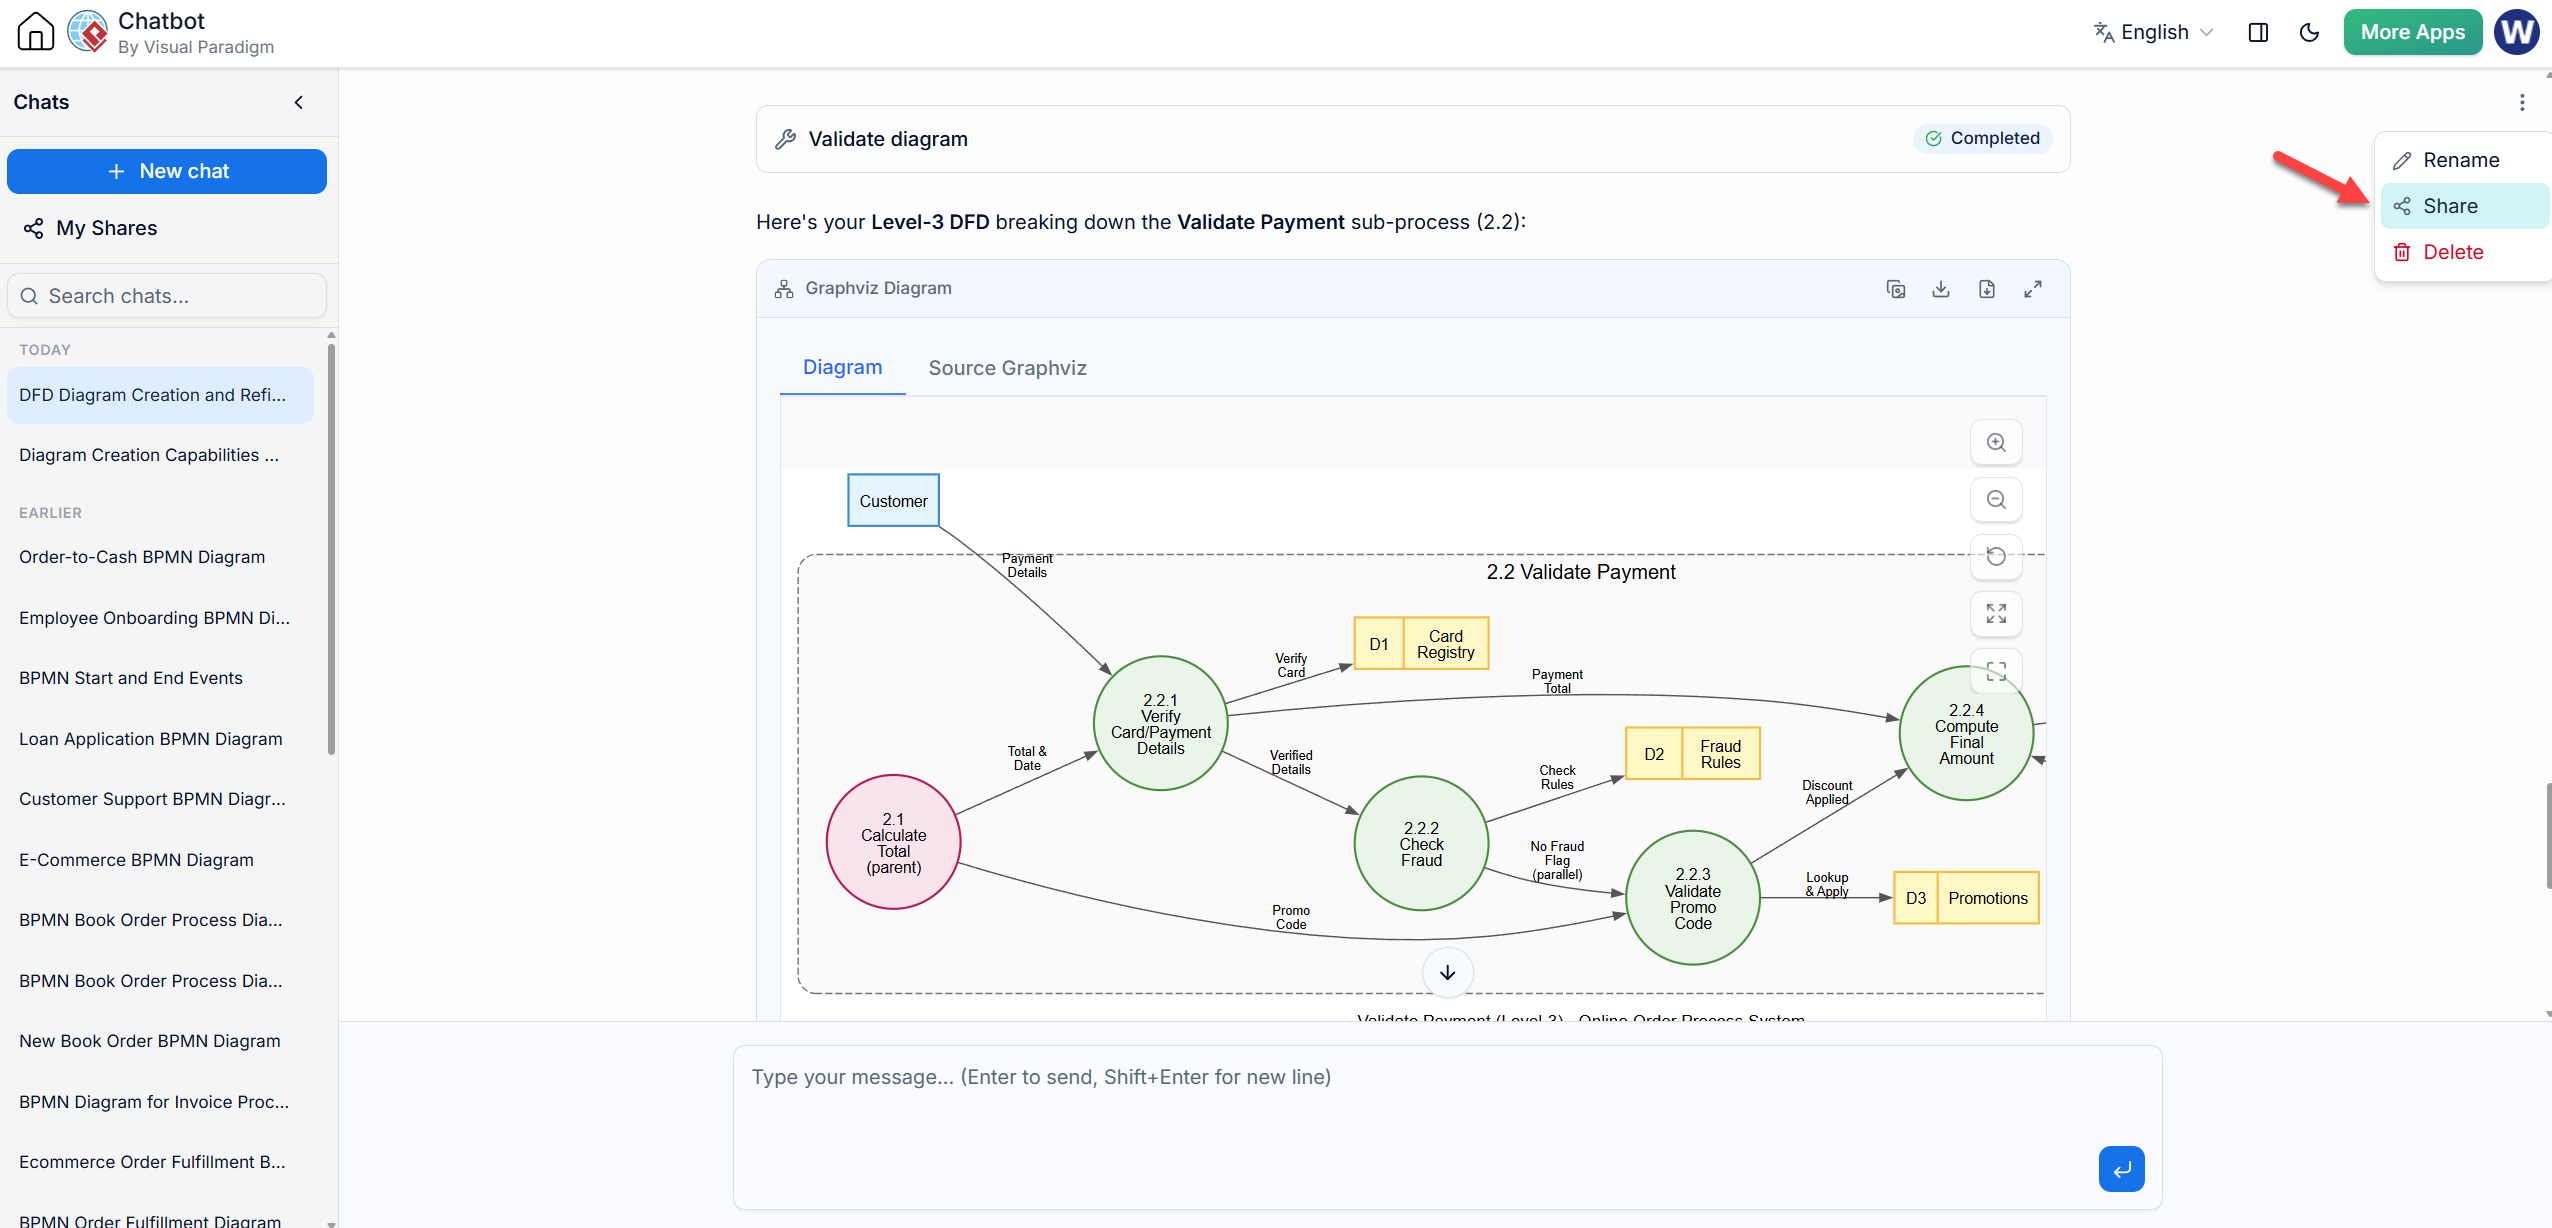
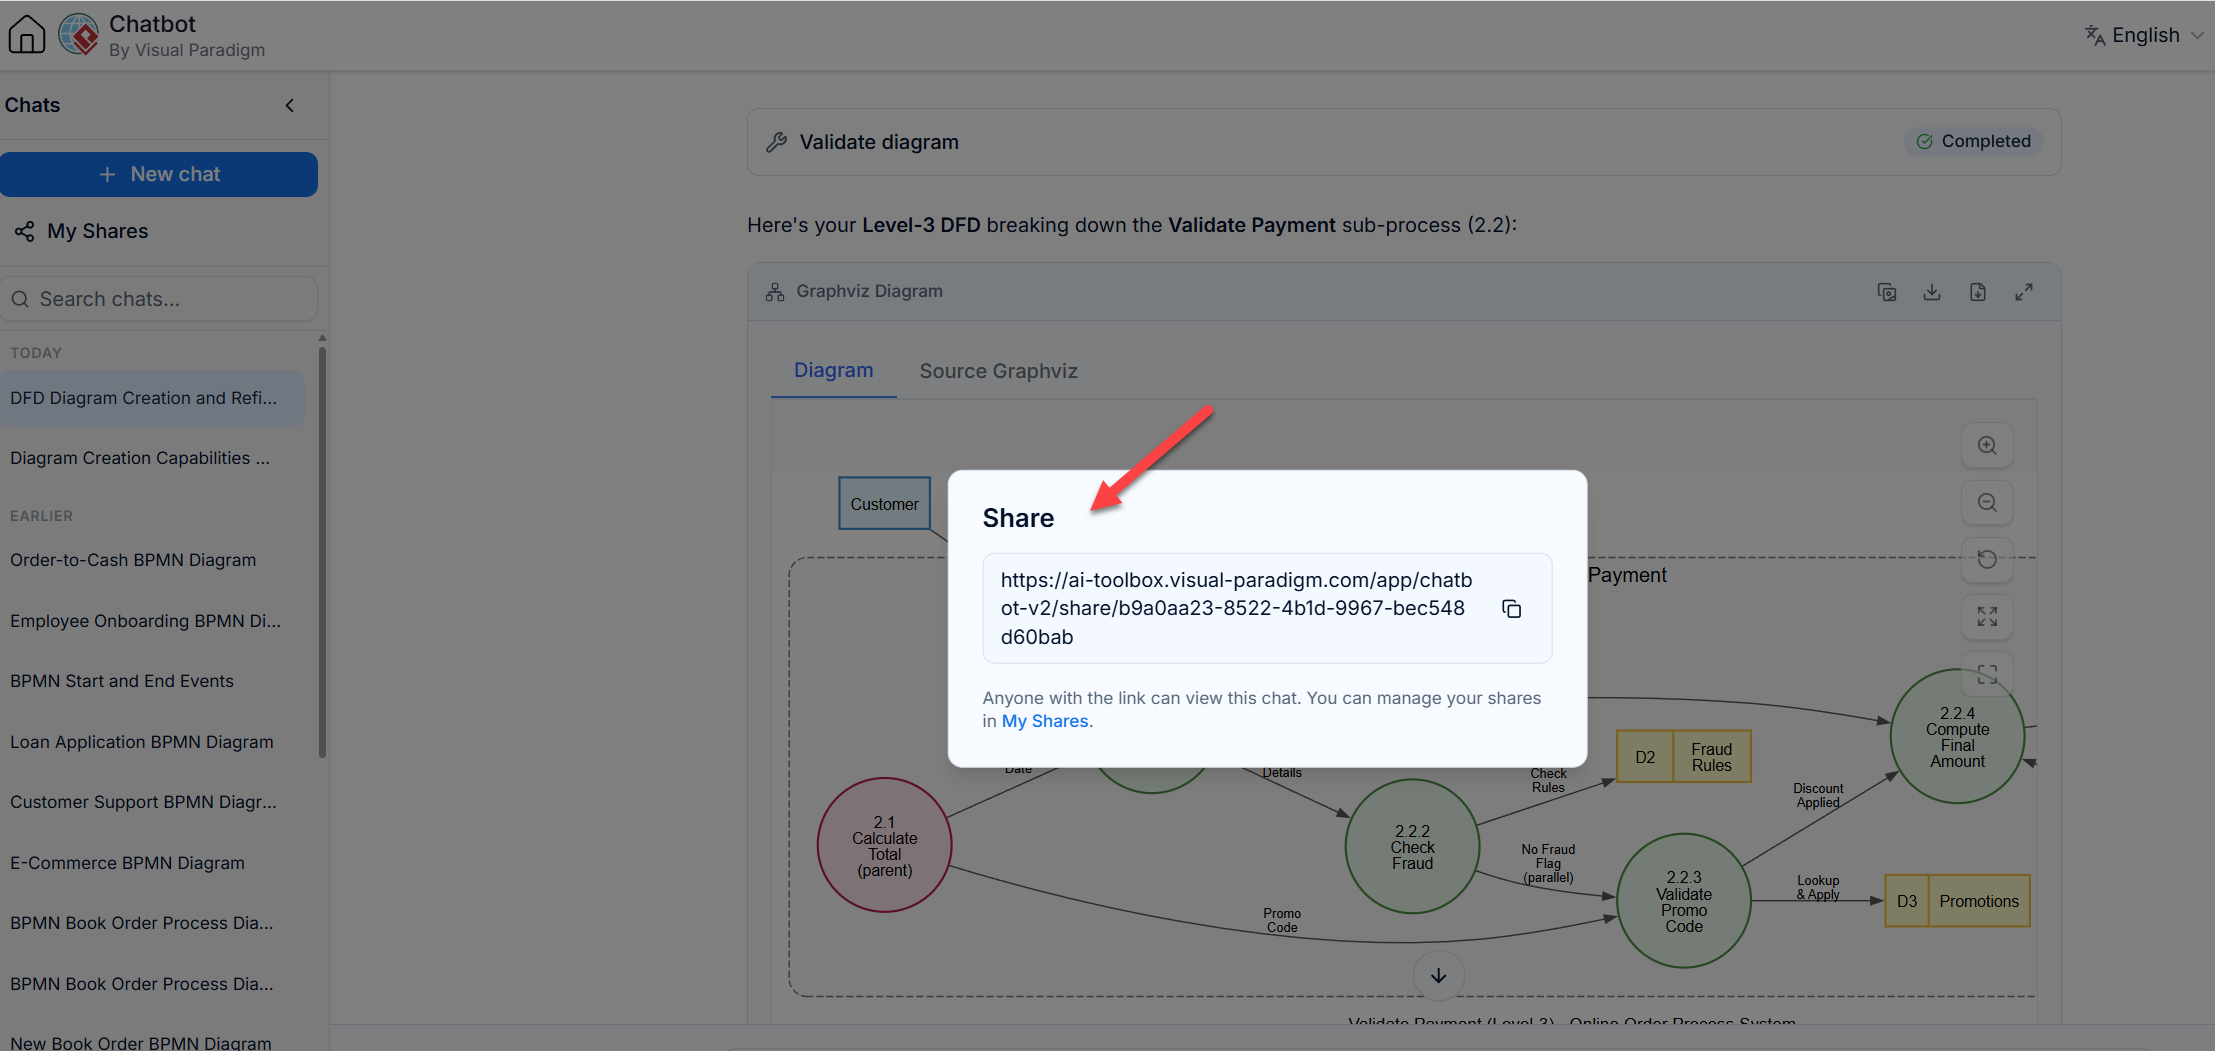
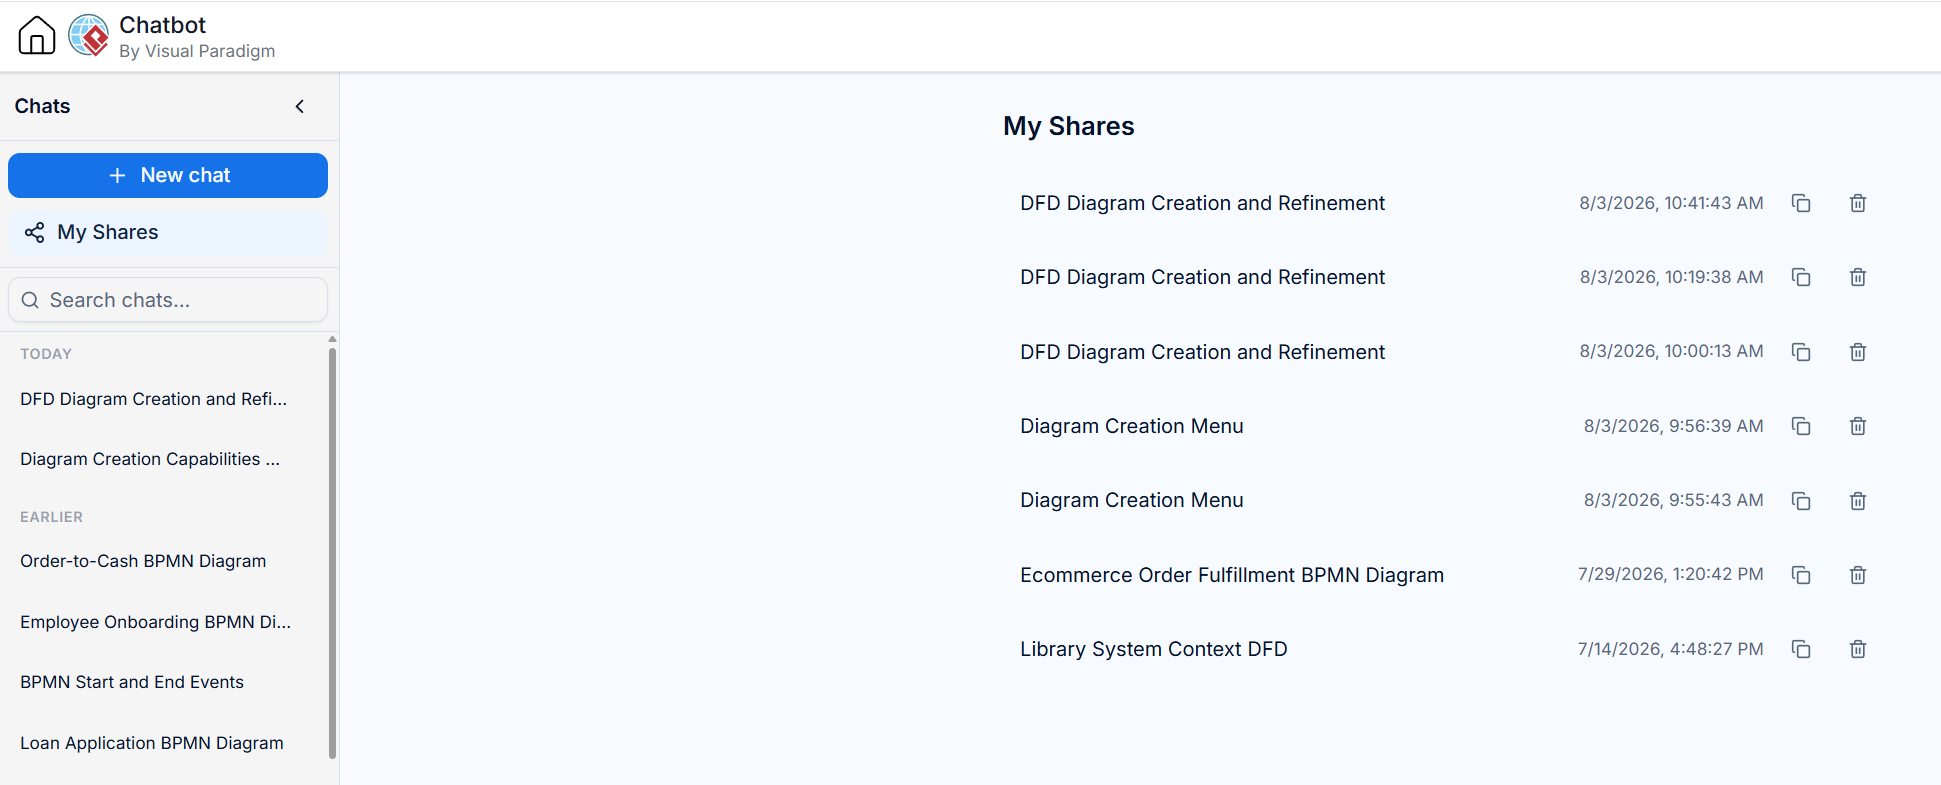
Share your AI session URL with team members to enable collaborative refinement. This ensures everyone works from the same contextual baseline.
Conclusion
AI-assisted top-down decomposition represents a significant evolution in system modeling. By pairing the rigorous methodology of traditional DFDs with the generative power of the Visual Paradigm AI Chatbot, analysts can focus on logical correctness rather than graphical layout. The ability to converse with your model, drill down into specific processes, and maintain persistent shared sessions transforms DFD creation from a solitary documentation task into a dynamic, collaborative design activity. Whether you are architecting a new e-commerce platform or re-engineering legacy workflows, AI-assisted DFDs ensure clarity, consistency, and alignment across all levels of system abstraction.
Recommended Resources: Visual Paradigm DFD & AI Tools
- AI Data Flow Diagram Generator by Visual Paradigm: Official guide on using the VP AI Chatbot specifically for generating and refining DFDs through natural language prompts.
- Understanding Data Flow Diagram Levels and Levelling Criteria: Detailed explanation of DFD hierarchy, balancing rules, and criteria for determining when to decompose a process further.
- What is Data Flow Diagram?: Comprehensive overview of DFD fundamentals, including symbol definitions, logical vs. physical distinctions, and best practices.
- AI Yourdon DeMarco DFD Generator: Specialized guide for generating DFDs using the classic Yourdon/DeMarco notation style via AI assistance.
- Online DFD Maker Features: Feature breakdown of Visual Paradigm’s web-based DFD editor, highlighting manual editing capabilities alongside AI generation.
Related posts:
 Use Cases Are More Than Just Ovals: Unlock Hidden Power with AI Tools
 Value Stream Mapping Feels Hard? Let an AI Tool Do the Heavy Lifting!
 AI Deployment Diagram Tools: A Skeptic’s Guide to Seeing Is Believing
My First Week with OpenDocs’ AI ERD Generator: A Hands-On Review from a Database Developer
AI Deployment Diagram Tools: A Skeptic’s Guide to Seeing Is Believing
My First Week with OpenDocs’ AI ERD Generator: A Hands-On Review from a Database Developer