
Mastering Cloud Architecture with Visual Paradigm AI Chatbot
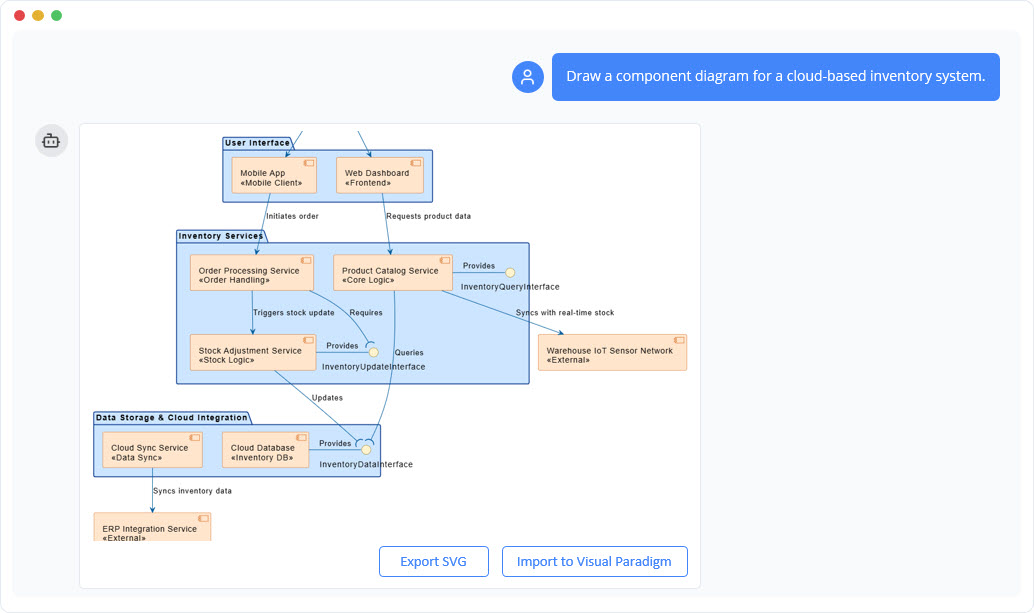
In the rapidly evolving landscape of cloud computing and microservices, visualizing how complex systems interact is crucial for successful deployment. This tutorial explores how the Visual Paradigm AI Chatbot revolutionizes the creation of Component Diagrams. Unlike traditional tools that require manual drag-and-drop of every box, this AI-driven approach allows users to treat their architectural models as living documents. By simply typing natural language commands, developers can instantly generate sophisticated diagrams, such as the cloud-based inventory system shown below.
As we analyze the generated diagram, we will break down the system’s architecture into logical layers, understanding how data flows from the user interface down to the cloud database and external sensors.
Understanding the Component Diagram Structure
A Component Diagram is a structural diagram used in Unified Modeling Language (UML) to describe the organization and interaction of components within a system. In the context of the AI-generated diagram, we can see the system organized into distinct logical groupings, often referred to as “packages” or “subsystems.” These groupings help manage complexity by isolating specific responsibilities.
1. The User Interface Layer
At the top of the hierarchy, we see the entry points for the system. This layer represents the “Frontend” or client-side applications where users interact with the inventory data.
- Mobile App: Represented as a «Mobile Client», this component handles user interactions on handheld devices.
- Web Dashboard: The browser-based interface, likely used by administrators or warehouse staff for deeper analysis.
The AI has correctly identified that these components Initiate Order and Request Product Data. This demonstrates the AI’s ability to understand standard user flows and translate them into directed associations.
2. The Inventory Services Layer (Core Logic)
The middle section, labeled “Inventory Services,” represents the “Brain” of the application. This is where the business logic resides. It is broken down into specialized microservices:
- Order Processing Service: This component handles the lifecycle of an order, specifically tagged as «Order Handling». It acts as the primary consumer of user requests.
- Product Catalog Service: Tagged as «Core Logic», this component manages the static data regarding what products exist, their descriptions, and pricing.
- Stock Adjustment Service: Tagged as «Stock Logic», this component is critical for dynamic updates. It manages the real-time inventory levels.
Interfaces and Contracts: Notice the “lollipop” symbols (provided interfaces) on these components. For example, the Product Catalog Service provides the InventoryQueryInterface. This is a vital architectural concept: it means other components can “plug in” to the catalog service to ask questions without needing to know how the data is stored internally.
3. Data Storage & Cloud Integration
The bottom layer, “Data Storage & Cloud Integration,” represents the persistence and external connectivity of the system.
- Cloud Database: The «Inventory DB» stores the master data. It provides the
InventoryDataInterfaceto the services above. - Cloud Sync Service: The «Data Sync» component acts as a bridge, ensuring that data in the cloud remains consistent with other systems.
- ERP Integration Service: An external system component. In enterprise architecture, an ERP (Enterprise Resource Planning) system is often the source of truth for financial data. The sync service ensures inventory counts match financial records.
External Integration and Real-Time Data
One of the most advanced features visible in this diagram is the inclusion of the Warehouse IoT Sensor Network. This external component demonstrates how modern inventory systems are not just software databases, but physical-digital hybrids.
The diagram shows that the Inventory Services layer queries this network. This implies a high-frequency data flow where the software listens to physical sensors (e.g., weight sensors on shelves or RFID scanners) to update stock levels automatically. This is a key architectural pattern for modern “Smart Warehousing.”
Refining Models with Conversational AI
The power of the Visual Paradigm AI Chatbot lies in its ability to refine this architecture dynamically. Instead of deleting and redrawing lines, a user can simply ask for changes. The AI interprets these natural language requests and updates the underlying model.
Practical Examples of AI Commands
Imagine you are reviewing this diagram with your team. Here is how you would use the chat interface to evolve the model:
Adding New Actors:
If the business decides to add a new role, such as a “Warehouse Manager,” you can simply type:
Add a Warehouse Manager actor who approves stock adjustments.
Renaming for Clarity:
If “Stock Adjustment Service” is too technical for your stakeholders, you can ask:
Rename Stock Adjustment Service to Inventory Control System.
Structural Updates:
If the system needs to handle failures gracefully, you might request:
Insert a retry loop on failed login attempts for the Web Dashboard.
Layout Adjustments:
If the diagram becomes too cluttered, the AI can reorganize it for presentation:
Make the layout more compact for a slide deck.
Key Architectural Concepts Revealed
By generating this diagram, the AI highlights several fundamental concepts of cloud architecture:
- Separation of Concerns: The diagram clearly separates the UI, the Business Logic, and the Data Layer. This makes the system easier to maintain and scale.
- Loose Coupling: The use of interfaces (the provided lollipop symbols) ensures that components are loosely coupled. The Order Processing Service doesn’t need to know how the Cloud Database works; it only needs to know the interface it provides.
- External Dependencies: The diagram explicitly marks external systems (like the IoT network and ERP) to show that the internal system relies on them.
Conclusion
The transition from static drawing to conversational modeling represents a significant leap in software design efficiency. By using the Visual Paradigm AI Chatbot, teams can focus on the logic and flow of their cloud-based inventory system rather than the mechanics of drawing lines. This approach allows for rapid prototyping, ensuring that the architecture evolves alongside the business requirements.