
Mastering Data Flow Modeling: DFDs & Top-Down Decomposition
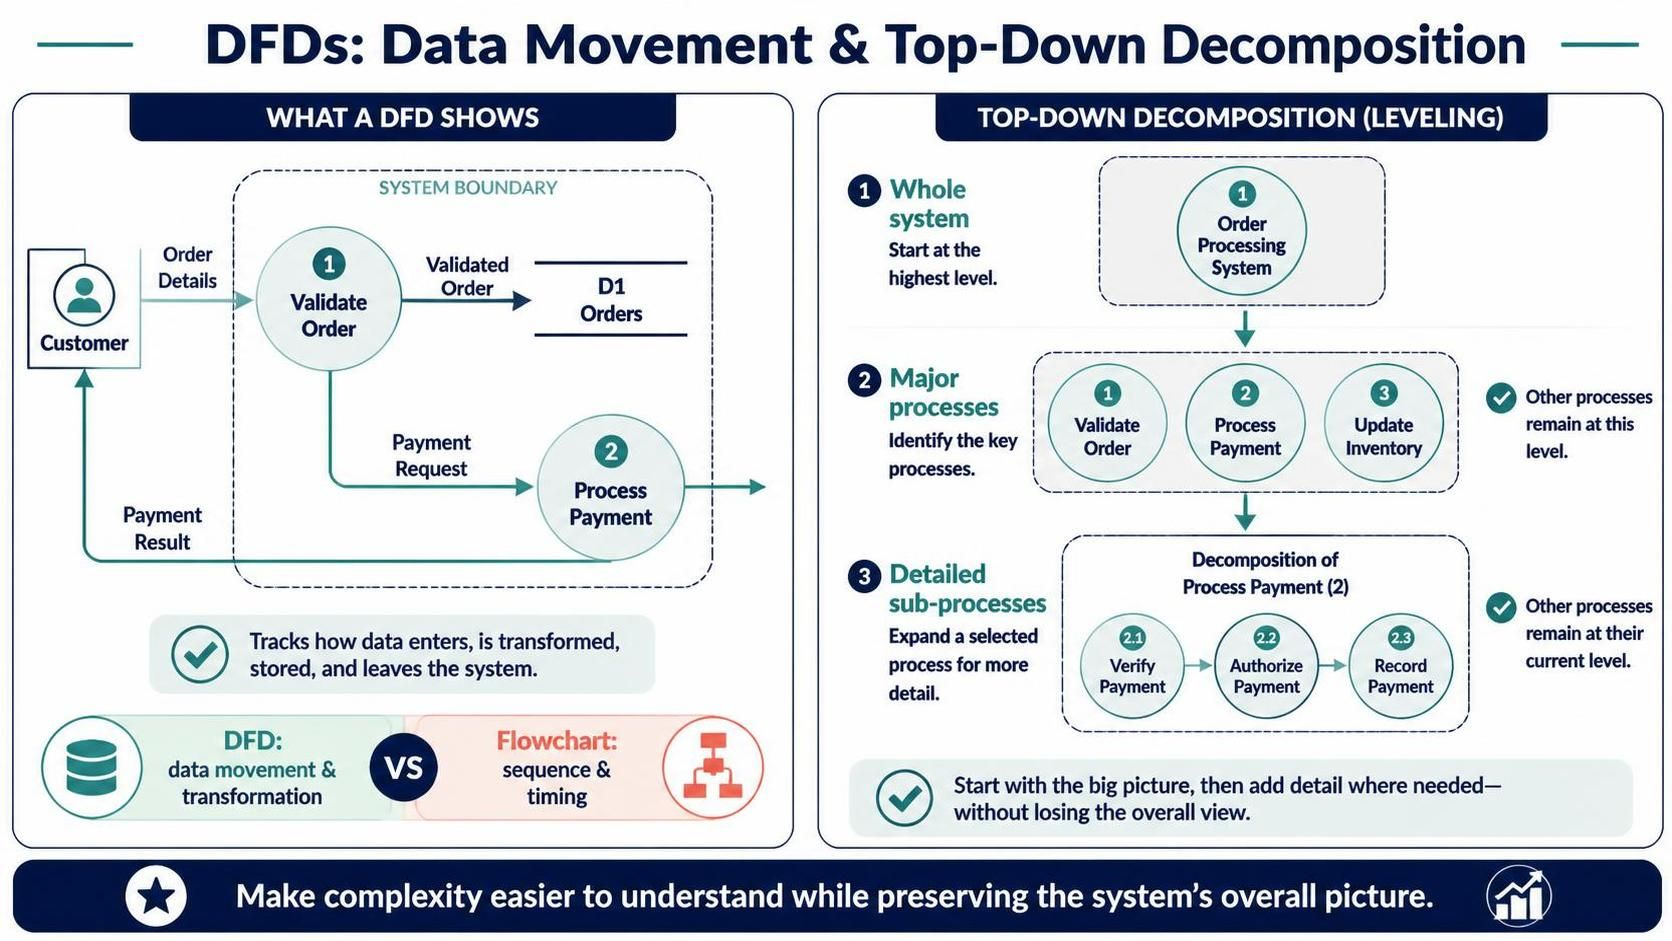
In the realm of systems analysis and design, clarity is king. One of the most powerful tools to achieve this clarity is the Data Flow Diagram (DFD). Unlike traditional flowcharts that obsess over the sequence of operations or the timing of events, a DFD focuses on the life of data itself: how it enters a system, how it is transformed, where it is stored, and how it exits.
This tutorial explores the foundational concepts of DFDs, using an online bookstore order-processing system as our case study. We will visualize the boundaries of the system and demonstrate the critical technique of Top-Down Decomposition (also known as leveling) to manage complexity.
Understanding the System Boundary
Every DFD must clearly define what is inside the system and what is outside. This is represented by the System Boundary.
- External Entities: These are actors (like the Customer) or external systems that interact with our system but are not part of it. They are the source and destination of data.
- Processes: The bubbles or circles inside the boundary represent functions or actions that transform data (e.g., Validate Order).
- Data Stores: These represent where data is held (e.g., D1 Orders).
Consider the Online Bookstore scenario. The system boundary encloses the logic of processing an order. The Customer sits outside, sending in “Order Details.” The system processes this data, potentially storing it in “D1 Orders,” and eventually sends a “Payment Result” back to the customer. This high-level view, often called a Context Diagram, provides the “big picture” without getting bogged down in internal details.
The Art of Top-Down Decomposition
As systems grow, a single diagram becomes cluttered and unreadable. This is where Top-Down Decomposition comes in. This technique allows us to “zoom in” on specific parts of the system while maintaining the context of the whole.
- Level 0 (The Whole System): We start with the high-level view. In our bookstore example, the entire system is simply one process: “Order Processing System.” This represents the system as a black box.
- Level 1 (Major Processes): We identify the key sub-processes that make up the system. We break the “Order Processing System” down into major functional areas, such as Validate Order, Process Payment, and Update Inventory. At this stage, we focus on the major data flows.
- Level 2 (Detailed Sub-processes): If a specific process is still too complex, we decompose it further. For instance, the Process Payment bubble from Level 1 can be expanded into a detailed sequence: Verify Payment, Authorize Payment, and Record Payment.
The golden rule of leveling is balancing: the inputs and outputs of a parent process must match the inputs and outputs of its child processes. You are simply adding detail, not changing the fundamental data flow.
DFD vs. Flowchart: A Critical Distinction
It is a common mistake to confuse Data Flow Diagrams with Flowcharts. While they may look similar, they serve different purposes.
- DFD (Data Movement & Transformation): Focuses on what data is processed. It is declarative. It does not show loops, decisions (if/else), or time. It is the “map” of data.
- Flowchart (Sequence & Timing): Focuses on how the logic flows. It includes decision diamonds, loops, and the exact order of execution. It is imperative.
When modeling an online bookstore, use a DFD to understand the data requirements and storage needs. Use a flowchart only if you are designing the specific algorithmic logic for a single step, such as “How to calculate tax.”
Conclusion
By mastering the system boundary and applying top-down decomposition, you can make complex systems easier to understand without losing the overall picture. Whether you are using Visual Paradigm or sketching on a whiteboard, always remember: your goal is to track data, not to dictate the timing of actions.