
From SQL to ERD: Visualizing DB Schemas with VPasCode AI Chatbot
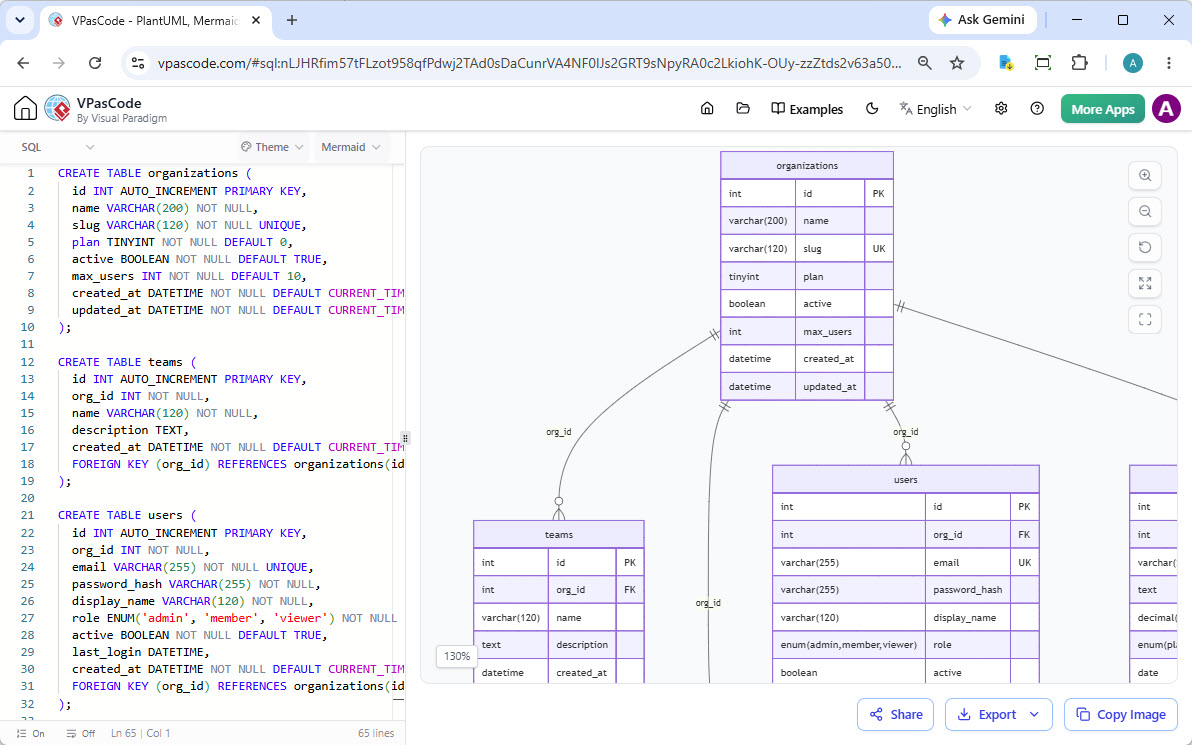
In the modern era of software development, the gap between writing code and visualizing its impact can often be a source of confusion. Database schema design, in particular, requires a deep understanding of relationships, constraints, and data types. The screenshot provided illustrates a powerful workflow using VPasCode, a tool that bridges the gap between raw SQL syntax and visual Entity-Relationship Diagrams (ERD).
This tutorial explores the architecture of this workflow, explaining how a developer can transition from a text-based SQL definition to a visual representation of a multi-table database system in real-time.
Understanding the Core Architecture
The system shown in the image operates on a bidirectional, code-driven rendering model. On the left, we see the Source Code Editor, where the logic is defined. On the right, we see the Visualization Canvas, which renders the logical structure.
The SQL Source (Left Pane)
The foundation of this system is standard SQL (Structured Query Language). The editor displays three distinct CREATE TABLE statements. This is not just a script; it is the single source of truth for the data model.
- Data Definition: The code defines the schema using standard SQL keywords. For example,
INT AUTOINCREMENT PRIMARY KEYestablishes unique identifiers for each row. - Data Types: Specific constraints like
VARCHAR(200)orBOOLEANensure data integrity. - Relationships: The most critical part of the schema is found in the Foreign Key constraints. Look at the
FOREIGN KEY (orgid) REFERENCES organizations(id)line. This defines the “One-to-Many” relationship between the parent organization and its children (teams or users).
The Visual Canvas (Right Pane)
The VPasCode tool parses the SQL on the left and automatically generates the visual components on the right. This involves:
- Node Generation: Each
CREATE TABLEstatement becomes a vertical rectangle (node) representing a database table. - Column Rendering: Each column defined in the SQL becomes a row within the table node, annotated with its data type (e.g.,
int,varchar). - Constraint Annotation: The tool visually highlights keys. “PK” denotes a Primary Key, “UK” a Unique Key, and “FK” a Foreign Key.
- Graph Drawing: Lines are drawn between tables to represent the relationships defined by the Foreign Keys. The crow’s foot notation (the lines branching out) visually indicates the cardinality of the relationship.
Step-by-Step Modeling Analysis
Let’s break down the specific logic demonstrated in the provided screenshot to understand how the model is structured.
1. The Root Entity: organizations
The organizations table serves as the parent entity. It contains metadata about an organization, including its name, a unique slug, and a plan type. This table acts as the anchor for the entire schema.
CREATE TABLE organizations (
    id INT AUTO_INCREMENT PRIMARY KEY,
    name VARCHAR(200) NOT NULL,
    slug VARCHAR(120) NOT NULL UNIQUE,
    plan TINYINT NOT NULL DEFAULT 0,
    active BOOLEAN NOT NULL DEFAULT TRUE,
    max_users INT NOT NULL DEFAULT 10,
    created_at DATETIME NOT NULL DEFAULT CURRENT_TIMESTAMP,
    updated_at DATETIME NOT NULL DEFAULT CURRENT_TIMESTAMP
);
2. The Child Entity: teams
The teams table is a direct child of organizations. Notice the orgid column. This is a foreign key. In the diagram, you can see a line connecting organizations to teams. The line has a “crow’s foot” symbol at the teams end, indicating that one organization can have many teams.
CREATE TABLE teams (
    id INT AUTO_INCREMENT PRIMARY KEY,
    org_id INT NOT NULL,
    name VARCHAR(120) NOT NULL,
    description TEXT,
    created_at DATETIME NOT NULL DEFAULT CURRENT_TIMESTAMP,
    FOREIGN KEY (org_id) REFERENCES organizations(id)
);
3. The User Entity: users
Similarly, the users table is linked to organizations via the orgid column. This creates a hierarchy where users belong to organizations. The diagram shows the relationship line clearly originating from the parent organizations node and terminating at the users node.
CREATE TABLE users (
    id INT AUTO_INCREMENT PRIMARY KEY,
    org_id INT NOT NULL,
    email VARCHAR(255) NOT NULL UNIQUE,
    password_hash VARCHAR(255) NOT NULL,
    display_name VARCHAR(120) NOT NULL,
    role ENUM('admin', 'member', 'viewer') NOT NULL,
    active BOOLEAN NOT NULL DEFAULT TRUE,
    last_login DATETIME,
    created_at DATETIME NOT NULL DEFAULT CURRENT_TIMESTAMP,
    FOREIGN KEY (org_id) REFERENCES organizations(id)
);
Advanced Features and Workflow
The screenshot reveals several advanced capabilities of the VPasCode environment:
- Real-time Rendering: The visualizer updates as the code is written. There is no need to manually draw boxes and lines; the tool derives the topology directly from the code.
- Zoom and Pan: The interface includes zoom controls (130% visible in the screenshot), allowing developers to inspect complex schemas without losing context.
- Export and Share: Buttons for “Share,” “Export,” and “Copy Image” indicate that the visualization is designed for documentation and team collaboration.
Conclusion
The transition from SQL text to ERD diagrams is a critical skill for database architects and developers. By using tools like VPasCode, you can maintain a single source of truth (the code) while instantly generating documentation (the diagram). This approach reduces errors, ensures consistency, and provides an immediate visual understanding of your system’s data architecture.