The modern customer experience is complex. It is not a straight line from interest to transaction. It is a web of interactions, emotions, and decisions that unfold over time. To understand this complexity, organizations must look beyond sales data and into the lived experience of the buyer. This is where journey mapping becomes essential. By visualizing the path to purchase, teams can identify friction points, align internal processes, and create a seamless experience that resonates with the customer.
This guide provides a practical approach to customer journey mapping. It focuses on the mechanics of visualization, the psychology of the buyer, and the strategic steps required to turn data into actionable insights. There are no specific tools mentioned here, only principles that apply regardless of the platform you use. The goal is clarity, empathy, and measurable improvement.
1. What is Customer Journey Mapping? 🧭
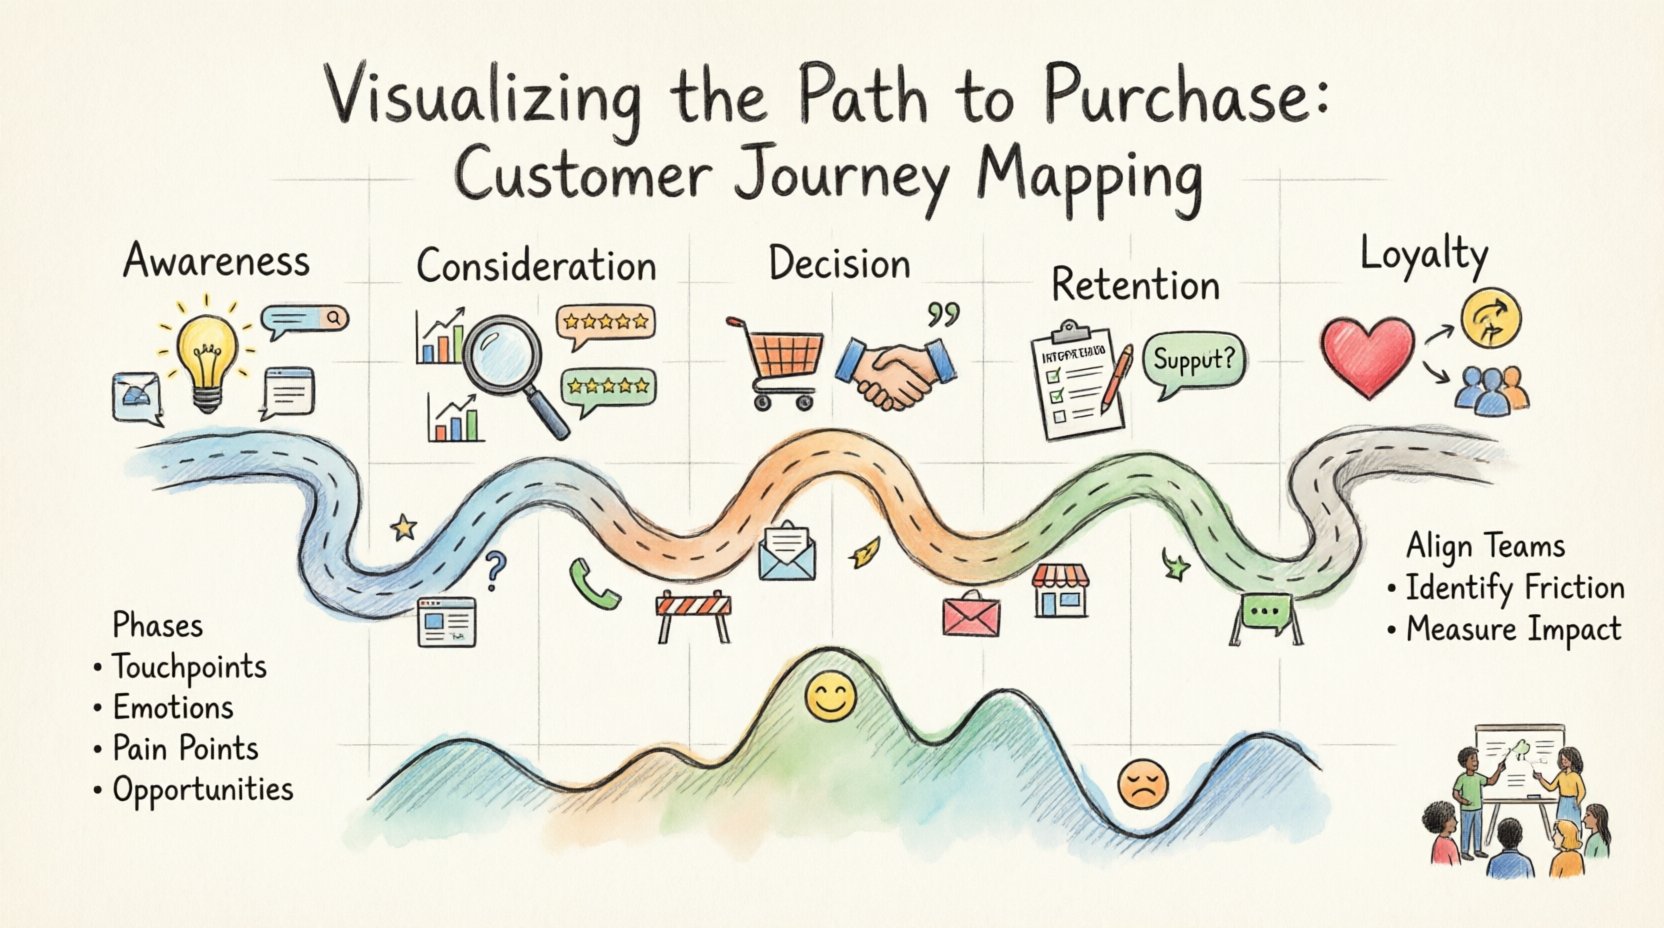
A customer journey map is a visual representation of every experience your customer has with your brand. It spans from the initial moment they become aware of a problem to the final transaction and beyond. It is not merely a flowchart of steps. It is a narrative that includes:
- Phases: The distinct stages of the relationship (e.g., Awareness, Consideration, Purchase).
- Touchpoints: Every channel where the customer interacts with the brand (website, email, sales call, physical store).
- Emotions: How the customer feels at each stage (frustrated, excited, confused, confident).
- Pain Points: Obstacles that prevent the customer from moving forward smoothly.
- Opportunities: Moments where the business can add value or solve a problem.
When you visualize the path to purchase, you stop seeing the customer as a metric. You start seeing them as a person with needs, constraints, and expectations. This shift in perspective is the foundation of effective customer experience management.
2. Why Visualize the Path to Purchase? 📊
Businesses often operate in silos. The marketing team focuses on lead generation. The sales team focuses on closing deals. The support team focuses on retention. These teams rarely share a unified view of the customer. As a result, the customer receives fragmented messaging and inconsistent service.
Journey mapping breaks down these silos. It creates a single source of truth that everyone can reference. Here are the core benefits:
- Alignment: All departments understand the customer’s perspective, not just their own KPIs.
- Friction Identification: You can spot where customers drop off before you lose revenue.
- Resource Allocation: You know exactly where to invest time and budget for maximum impact.
- Empathy: It humanizes the data, reminding teams that real people are behind the numbers.
- Consistency: It ensures the brand voice and service quality remain steady across all channels.
3. Core Stages of the Path to Purchase 🛒
While every industry has nuances, the general path to purchase follows a predictable pattern. Understanding these stages helps in structuring your map. Below is a breakdown of the typical phases.
| Stage | Customer Goal | Key Question | Common Channels |
|---|---|---|---|
| Awareness | Recognize a problem or need | “What is happening?” | Social Media, Search, Word of Mouth |
| Consideration | Evaluate solutions | “Which option is best?” | Comparisons, Reviews, Webinars |
| Decision | Choose a provider | “Why should I buy this?” | Quotations, Demos, Sales Calls |
| Retention | Use the product effectively | “Is this working for me?” | Onboarding, Support, Updates |
| Loyalty | Advocate for the brand | “Do I recommend this?” | Referrals, Reviews, Community |
It is important to note that this is not always linear. A customer might jump between consideration and awareness multiple times. The map must reflect this non-linear reality.
4. Preparing for the Mapping Workshop 🛠️
Creating a map is a collaborative effort. It cannot be done in isolation by a single strategist. You need input from across the organization to ensure accuracy. Before you begin drawing the journey, prepare your team.
4.1. Define the Scope
Do not try to map every single customer interaction at once. Start with a specific persona or a specific product line. This keeps the project manageable. A clear scope prevents scope creep and ensures you can gather the necessary depth of detail.
4.2. Gather Data Sources
Empirical data is better than assumption. Collect information from:
- Customer Interviews: Direct conversations with buyers about their decision process.
- Support Tickets: Review common complaints to find recurring pain points.
- Analytics: Look at drop-off rates on websites or in funnels.
- Sales Feedback: Ask sales representatives what objections they hear most often.
- Surveys: Net Promoter Score (NPS) and Customer Satisfaction (CSAT) data.
4.3. Select the Right Persona
A journey map is tied to a user persona. This is a fictional representation of your ideal customer based on real data. Ensure your team agrees on who this person is. Are they tech-savvy? Are they price-sensitive? Do they need hand-holding? The answers to these questions dictate the tone and content of the map.
5. Step-by-Step Mapping Process 📝
Once preparation is complete, move into the active mapping phase. This process can be done on a whiteboard, a large sheet of paper, or a digital canvas. The medium matters less than the rigor of the thinking.
5.1. Map the Phases
Draw the stages of the journey horizontally across the top or vertically down the side. Label them clearly using the terminology your customers use, not internal jargon. If customers call it “signing up,” do not call it “conversion.”
5.2. Plot the Touchpoints
Under each phase, list every interaction the customer has. Be exhaustive. If a customer checks a price on mobile, then on desktop, then asks a friend, that is three touchpoints. Include both digital and physical interactions.
5.3. Add the Customer Voice
For each touchpoint, write down what the customer is thinking or feeling. Use quotes from interviews if available. This brings the map to life. For example, instead of saying “User views pricing page,” write “User worries the cost is higher than budget.”
5.4. Identify Friction and Emotions
Draw a line across the bottom representing the emotional curve. Mark peaks of happiness and valleys of frustration. Wherever the customer feels confused or stuck, mark it as a friction point. These are your priorities for improvement.
6. Common Friction Points ⚠️
When analyzing your map, look for specific patterns where the path becomes difficult. These are the areas that cause abandonment or dissatisfaction.
- Information Overload: Too many choices or complex language can paralyze the decision-making process.
- Access Barriers: If a customer cannot find a phone number or a live chat option, trust erodes quickly.
- Inconsistency: If the promise made in an ad does not match the reality on the landing page, the customer feels deceived.
- Slow Response Times: Waiting for a reply to an inquiry kills momentum and allows competitors to step in.
- Unclear Next Steps: If the customer finishes an action but doesn’t know what to do next, they may leave the site.
Addressing these issues requires cross-functional cooperation. A friction point in the decision phase might be a marketing problem (misleading ads) or a sales problem (slow response). The map helps assign ownership.
7. Validating the Map ✅
Once the draft map is complete, you must verify it against reality. An internal map can easily drift into fantasy if it is not checked. Validation ensures the map reflects the actual customer experience.
- Walk the Path: Have team members go through the journey themselves. Act as the customer. Where do you get stuck?
- Customer Validation: Show the map to actual customers. Ask them if it matches their experience. This is often done in follow-up interviews.
- Data Verification: Check analytics to see if the behaviors described on the map match the actual data. If the map says customers look at reviews, does the data show they visit the review page?
Validation is not a one-time event. It is a quality control step that ensures your strategy is grounded in fact.
8. Measuring Performance 📈
Mapping is useless if you cannot measure the impact of changes. Define metrics that align with the stages of the journey. This allows you to track progress over time.
- Conversion Rate: Measures success in the Decision stage.
- Time to Value: Measures efficiency in the Retention stage.
- Churn Rate: Indicates failure in the Loyalty stage.
- Customer Effort Score (CES): Measures how easy it is for the customer to achieve their goals.
- Referral Rate: Indicates high satisfaction in the Loyalty stage.
Set baselines before making changes. Then, monitor these metrics after implementing improvements suggested by the map. This closes the loop between strategy and execution.
9. Keeping the Map Alive 🔄
A journey map is not a document to be filed away. It is a living tool. The market changes, competitors enter, and customer expectations evolve. A static map becomes obsolete quickly.
To maintain relevance:
- Review Quarterly: Schedule regular reviews to update the map based on new data.
- Update Personas: If your target audience shifts, update the persona details on the map.
- Share Widely: Ensure new hires and other departments have access to the latest version.
- Iterate on Fixes: As you solve friction points, add the new solutions to the map.
By treating the map as a dynamic asset, you ensure your organization remains agile and customer-centric. This continuous improvement cycle is the key to long-term growth.
10. Integrating Insights into Strategy 🧩
The final step is turning insights into action. A map that sits on a shelf provides no value. You must integrate the findings into business operations.
10.1. Product Development
If the map shows customers struggle with a specific feature, prioritize that feature in the development roadmap. If they desire a new functionality that competitors have, evaluate its necessity.
10.2. Marketing Content
Adjust your content strategy to match the customer’s questions at each stage. If they are in the consideration phase, provide comparison guides and case studies. If they are in the awareness phase, provide educational blog posts.
10.3. Training Programs
Use the map to train customer-facing staff. Sales teams should understand the emotional hurdles buyers face. Support teams should know the pain points that lead to complaints. This alignment improves service quality.
10.4. Budget Allocation
Direct investment toward the touchpoints that matter most. If the map shows that mobile checkout is a major friction point, invest in optimizing the mobile experience rather than expanding the desktop features.
Conclusion on Next Steps 🚀
Visualizing the path to purchase is a powerful exercise in empathy and strategy. It forces organizations to step out of their internal view and see the world through the eyes of the buyer. By following the steps outlined in this tutorial, you can build a map that drives real change.
Start small. Pick one persona. Map one journey. Identify one friction point. Fix it. Then repeat. Over time, these improvements compound into a superior customer experience. The journey never truly ends, but with the right map, you will always know which direction to take.
Remember, the goal is not perfection. It is progress. Every map is a snapshot in time. Keep updating it, keep listening to your customers, and keep refining the path you offer them. This is how sustainable growth is built.

