


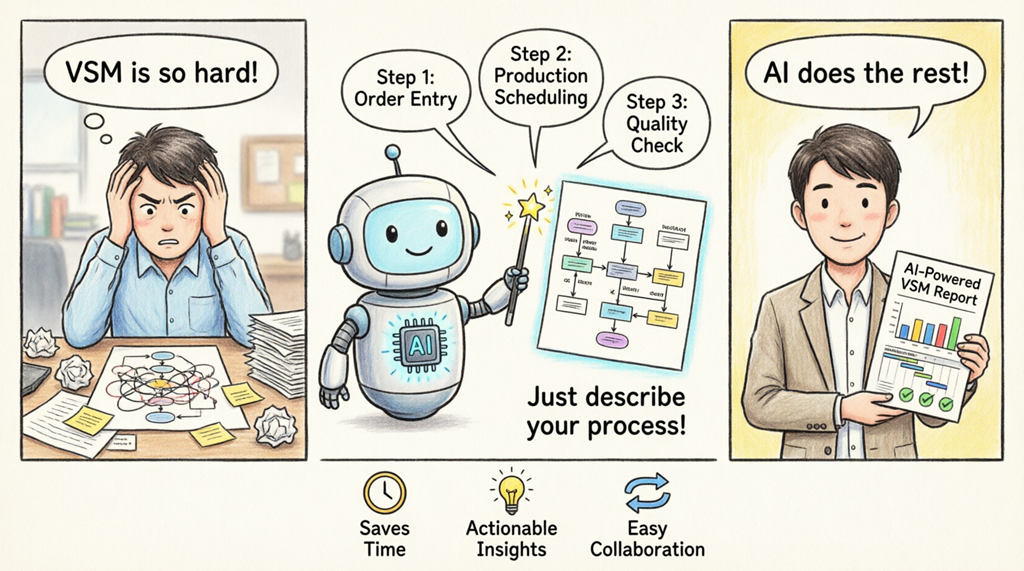
If the words “value stream mapping” make you nervous, you’re not alone. Many professionals find traditional VSM overwhelming—too many symbols, complex data, and hours of manual drawing. But what if you could create a professional value stream map in minutes, without being a lean expert? That’s exactly what the AI-powered Value Stream Mapping Editor from Visual Paradigm makes possible. This online AI value stream mapping tool transforms complicated processes into clear, visual diagrams—no prior experience required.
Whether you’re an operations manager, business analyst, or just someone trying to improve a workflow, this AI process mapping generator helps you see bottlenecks, spot waste, and make smarter decisions. Think of it as your personal lean consultant, available 24/7.
Why Traditional Value Stream Mapping Feels Difficult (And How AI Changes Everything)
Traditional VSM requires you to:
- Memorize dozens of standard symbols and notations
- Manually calculate lead times, cycle times, and inventory levels
- Draw complex diagrams by hand or with generic tools
- Interpret data without guided insights
The AI value stream mapping maker flips this script. Instead of starting from scratch, you simply describe your process in plain English. The online AI workflow analyzer does the rest: extracting steps, building the diagram, calculating metrics, and even suggesting improvements. It’s value stream mapping, simplified.
Quick Start: 3 Ways to Begin with This AI VSM Generator
When you open the Value Stream Mapping Editor, you’ll see three beginner-friendly options:
- AI-Guided Flow Detection: Describe your process in words, and let the AI business process analyzer generate your map automatically
- Industry Templates: Start with pre-built templates for manufacturing, healthcare, software, and more
- Manual Editor: Build your map step-by-step with drag-and-drop simplicity
Pro tip for beginners: Start with the AI-Guided option. You don’t need perfect details—just a rough description of your workflow. The online value stream diagram generator is designed to understand natural language and fill in the gaps.

Step-by-Step: Create Your First AI-Powered Value Stream Map
Step 1: Tell the AI About Your Process
Forget complex forms. Just type what you know. For example: “We make custom medical devices. Orders come in, we assemble parts, then sterilize, package, and ship. But there’s always a backlog between assembly and sterilization.”
The AI value stream mapping tool understands context. It identifies key steps, stakeholders, and potential pain points. Click “Analyze with AI,” and watch your description transform into a structured workflow.

Step 2: Review Your Instantly Generated Map
Within seconds, the online VSM generator produces a professional diagram using standard lean notation. You’ll see:
- Process boxes for each major step
- Inventory buffers (triangles) showing work-in-progress
- Information flows (dashed lines) triggering actions
- Timeline at the bottom showing value-added vs. wait time
This isn’t just a pretty picture—it’s a data-rich AI-powered process visualization tool that calculates key metrics automatically. No manual math required!

Step 3: Zoom, Explore, and Understand
Use the zoom controls to explore details. Notice that large inventory triangle between Assembly and Sterilization? That’s your bottleneck—exactly what you described! The AI workflow optimizer makes problems visible at a glance.
Beginner insight: Don’t worry about understanding every symbol immediately. Focus on the flow: Where does work pile up? Where do delays happen? The visual nature of this online lean management tool helps you learn VSM concepts as you use them.

Step 4: Tweak Data Without Breaking a Sweat
See the configuration panel on the left? That’s your control center. Click any process step to edit:
- Cycle time (how long one unit takes)
- Uptime percentage (reliability)
- Number of operators
- Inventory levels
Changes update the diagram instantly. This interactive value stream mapping software lets you run “what-if” scenarios: What if we reduce assembly time by 20%? What if we add a second sterilization machine? See the impact before making real changes.

Step 5: Get AI-Powered Insights (No Analysis Degree Needed)
Here’s where the magic happens. Click the “AI Analysis” tab, and choose from report types:
- General Report: Overview of your value stream
- Quantitative Performance Report: Hard numbers on efficiency
- Executive and Strategic Report: Actionable recommendations for leadership
The AI business process analyzer doesn’t just summarize—it interprets. It identifies your biggest bottleneck, explains why it matters, and suggests specific improvements. It’s like having a lean expert review your map.

Step 6: Share Your Professional Report
The final report includes:
- KPI dashboard with Takt Time, Cycle Time, WIP, and First Pass Yield
- Clear bottleneck identification with root-cause analysis
- Prioritized improvement recommendations
- Export options for PNG, PDF, or presentation slides
This isn’t just documentation—it’s a communication tool. Use the AI-generated value stream report to align your team, secure budget for improvements, or track progress over time.

Beyond the Basics: Fresh Ideas to Maximize Your AI VSM Tool
Once you’re comfortable with the basics, try these advanced approaches:
- Compare Current vs. Future State: Duplicate your map, apply improvements in the copy, and use the online VSM comparison tool to visualize the impact
- Collaborate in Real-Time: Share your map with teammates for feedback—perfect for remote lean teams
- Integrate with Other Tools: Export data to Excel, PowerBI, or project management platforms for deeper analysis
- Track Improvements Over Time: Save versions of your map to measure progress month-over-month
- Use for Training: The visual, interactive nature of this AI process mapping software makes it ideal for teaching lean concepts to new team members
Who Benefits Most from This AI Value Stream Mapping Maker?
- Operations Managers: Quickly diagnose workflow issues without hiring external consultants
- Business Analysts: Translate complex processes into clear visuals for stakeholders
- Lean Practitioners: Accelerate VSM creation and focus energy on improvement, not drawing
- Small Business Owners: Access enterprise-grade process analysis without the enterprise price tag
- Students & Educators: Learn and teach value stream mapping with an intuitive, hands-on tool
Common Beginner Questions, Answered
Q: Do I need to know lean methodology to use this?
A: Not at all! The AI value stream mapping tool guides you through concepts as you go. You’ll learn VSM principles naturally while creating your map.
Q: What if my process is unique or complex?
A: The online AI workflow analyzer handles complexity well. Start with your core flow, then add details iteratively. The tool adapts to your needs.
Q: Can I use this for service processes, not just manufacturing?
A: Absolutely! This AI business process visualization tool works for healthcare, software development, customer service, logistics, and any workflow where value flows to a customer.
Q: How accurate is the AI analysis?
A: The AI provides intelligent suggestions based on lean principles and your data. Always review recommendations with your team context—but most users find the insights remarkably actionable.
Ready to Make Value Stream Mapping Simple?
You don’t need to be a lean expert to improve your processes. With the AI-powered Value Stream Mapping Editor, you can:
- Create professional VSM diagrams in minutes, not days
- Identify bottlenecks and waste with AI-powered insights
- Model improvements before implementing them
- Communicate process changes clearly to your team
Stop struggling with complex diagrams and manual calculations. Let this online AI value stream mapping generator do the heavy lifting while you focus on what matters: making your workflow better.
Try the Value Stream Mapping Editor now and experience how AI makes lean simple.
Learn More: Essential Value Stream Mapping Resources
Value stream mapping (VSM) is a strategic framework used to visualize workflows and identify inefficiencies within a process, ultimately helping teams to eliminate waste and improve value delivery. By mapping end-to-end processes, organizations can track lead times, identify bottlenecks, and align their capabilities with strategic goals.
- What Is Value Stream Mapping? A Complete Guide: A foundational guide explaining how VSM visualizes workflows to identify and eliminate waste, thereby improving process efficiency.
- Comprehensive Guide to Value Stream Mapping: This article covers the fundamentals, benefits, and step-by-step procedures for continuous business improvement through mapping.
- Value Stream Mapping Tool – Visual Paradigm: An overview of a tool designed to help organizations streamline processes and improve operational efficiency through visual analysis.
- Value Stream Mapping as an Artifact of the Vision Phase: Explores how VSM serves as a key artifact to align teams and define strategic direction during the early phases of product development.
- How to Use Value Stream Mapping in Six Sigma Projects: Details how VSM reveals process bottlenecks and reduces cycle times to enable data-driven improvements in Six Sigma contexts.
- Eliminate Waste with Value Stream Mapping: A Practical Approach: A practical guide for identifying and removing the eight types of waste in both manufacturing and service-based environments.
- Value Stream to Capability Cross-Mapping View in ArchiMate: A specialized template for enterprise architects to map value streams directly to organizational capabilities using the ArchiMate framework.

