The Unified Modeling Language (UML) provides a standardized way to visualize system design. Among the various diagram types, the Interaction Overview Diagram stands out as a crucial bridge between high-level process flows and detailed interaction sequences. This guide dissects every component of the UML Interaction Overview Diagram, offering a clear understanding of its structure, purpose, and implementation without relying on specific tools.
📊 What Is the Interaction Overview Diagram?
An Interaction Overview Diagram is a type of activity diagram that organizes a control flow into a sequence of interaction diagrams. It combines the best of two worlds: the flow logic of an Activity Diagram and the detailed object interaction of Sequence or Communication Diagrams. This hybrid approach allows architects to model complex systems where the order of operations matters, and the internal communication between components must be explicitly defined.
Think of this diagram as a roadmap for a journey. The Activity Diagram shows you the route from point A to point B, but the Interaction Overview Diagram adds the details of what happens inside the vehicle at each stop. It is particularly useful for:
- Modeling complex workflows involving multiple interactions.
- Visualizing the flow of control between different interaction diagrams.
- Managing conditional logic and decision points in system interactions.
- Providing a high-level view that can be drilled down into specific sequences.
🔑 Core Structural Elements
To effectively construct an Interaction Overview Diagram, one must understand the fundamental nodes that make up its structure. These elements dictate how the flow moves from one interaction to another.
1. Activity Nodes
Activity nodes are the primary containers for work or actions within the diagram. In the context of Interaction Overview, they represent the execution of a specific interaction flow. Unlike simple activity nodes in standard Activity Diagrams, these often encapsulate entire interaction sequences.
- Call Behavior Action: This node represents a call to another activity or interaction. It acts as a trigger for a specific sequence of events.
- Control Node: These nodes manage the flow of control. They include decision points, forks, joins, and merges.
2. Interaction Nodes
This is the defining feature of the Interaction Overview Diagram. An interaction node is a specialized activity node that encapsulates a specific interaction diagram (like a Sequence Diagram or Communication Diagram). It allows you to abstract complex object exchanges into a single block within the overview flow.
- Entry Point: Where the flow enters the interaction node.
- Exit Point: Where the flow exits after the interaction is complete.
- Content: The internal logic is hidden in the node itself, allowing the overview diagram to remain clean.
3. Initial and Final Nodes
Every diagram needs a starting point and an ending point to define scope.
- Initial Node: Represented by a filled black circle. This marks the beginning of the interaction flow.
- Final Node: Represented by a filled circle within a larger circle. This indicates the successful completion of the overall interaction.
- Activity Final Node: A similar symbol to the final node but specifically indicates the end of an activity region within a larger system.
⚙️ Control Flow and Connections
The lines connecting the nodes are just as important as the nodes themselves. These edges define the sequence, logic, and dependencies of the system behavior.
1. Object Flow
While primarily associated with standard activity diagrams, object flows can appear here to show the movement of data objects between interactions. This is less common in pure interaction overviews but is supported when data persistence across interactions is critical.
2. Control Flow
This is the most common connector. It represents the transfer of control from one node to another. It is typically a straight line with an arrowhead indicating direction.
- Sequential Flow: One action completes, then the next begins.
- Conditional Flow: A decision node directs the flow based on a guard condition (e.g., [data is valid]).
3. Fork and Join Nodes
Complex systems rarely run in a single straight line. These nodes handle concurrency.
- Fork Node: A thick bar that splits one incoming flow into multiple outgoing flows. This allows parallel interactions to occur simultaneously.
- Join Node: A thick bar that merges multiple incoming flows into one outgoing flow. The flow continues only after all incoming paths have reached this point.
🔗 Integration with Other UML Diagrams
The power of the Interaction Overview Diagram lies in its ability to link with other diagram types. It does not exist in isolation. Below is a table detailing how it interacts with other standard UML models.
| Diagram Type | Relationship | Usage Scenario |
|---|---|---|
| Sequence Diagram | Encapsulated | Used inside an interaction node to show detailed message passing between objects. |
| Communication Diagram | Encapsulated | Replaces Sequence Diagram when object topology is more important than time sequence. |
| State Machine Diagram | Triggered | An interaction node can trigger a transition in a state machine. |
| Component Diagram | Contextual | Provides the high-level flow that occurs between components defined in the component diagram. |
🛠️ Syntax and Visual Notation Rules
To maintain consistency and readability, specific visual rules apply to the drawing of this diagram. Adhering to these standards ensures that any stakeholder can interpret the model correctly.
- Shape of Interaction Nodes: Typically drawn as rounded rectangles, similar to activity nodes, but often labeled with the specific interaction diagram type (e.g., [Sequence Diagram]).
- Guard Conditions: Any control flow leaving a decision node must have a guard condition in square brackets (e.g., [Success], [Failure]).
- Labeling: Nodes should be labeled clearly. Interaction nodes should reference the specific scenario they represent.
- Directionality: All flows must be unidirectional unless specified otherwise. Arrows must point clearly from source to destination.
📝 Practical Application Scenarios
Understanding the theory is one thing; applying it is another. Here are common scenarios where this diagram adds significant value to the design process.
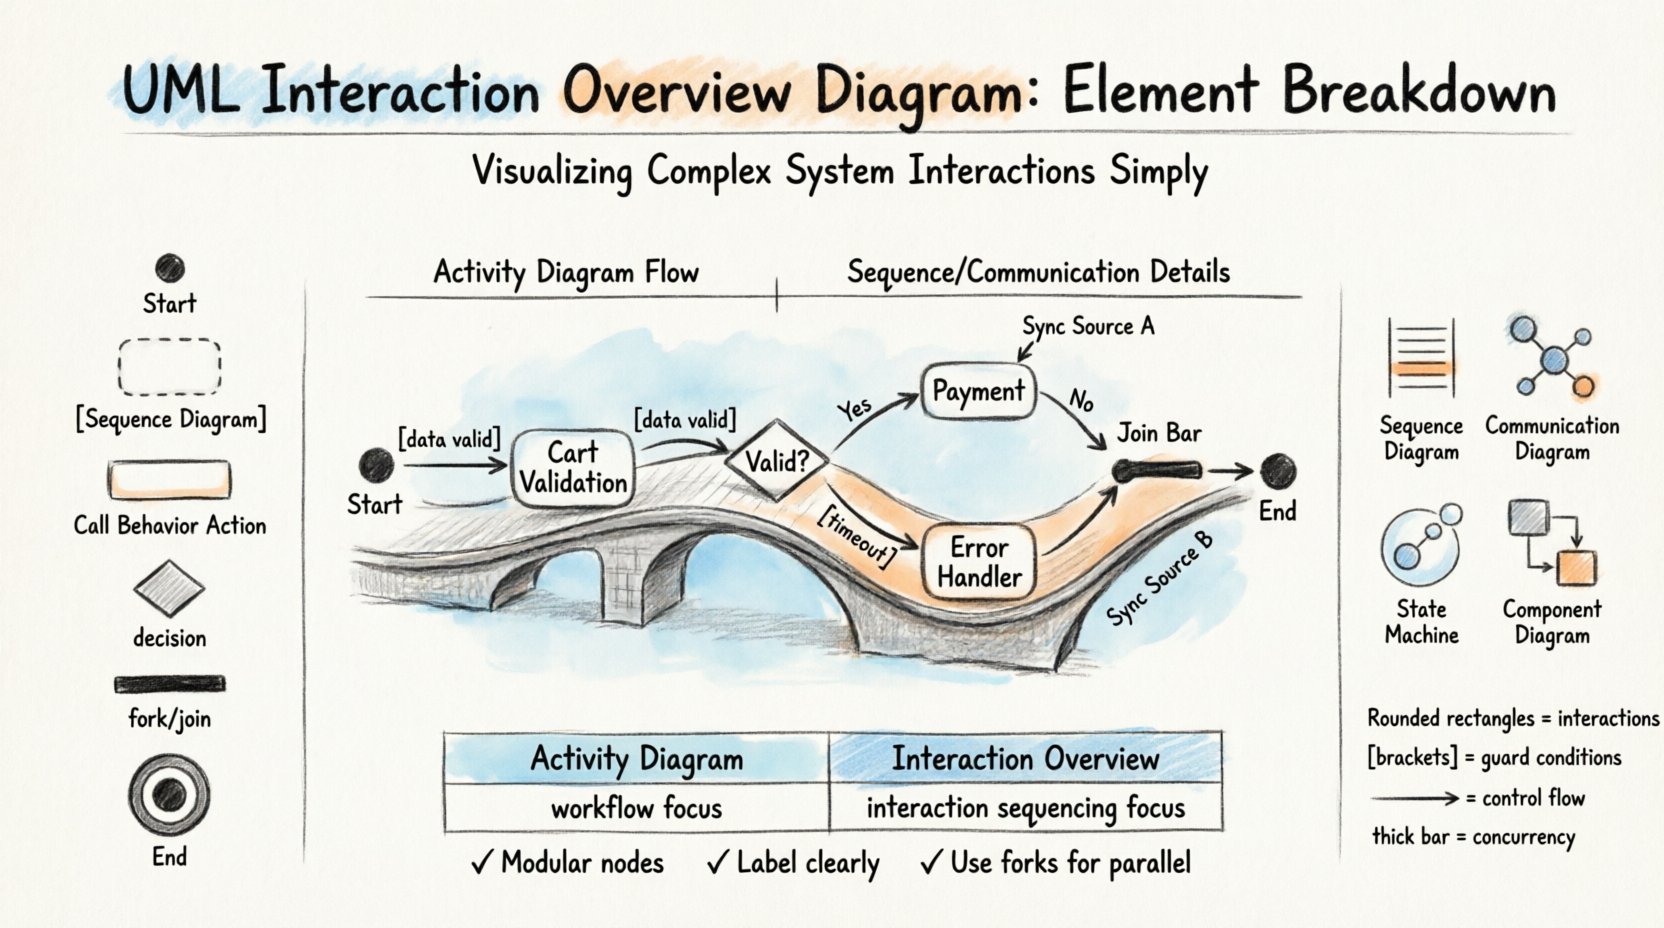
1. E-Commerce Checkout Process
In an online store, the checkout process is complex. It involves inventory checks, payment processing, and shipping calculations. An Interaction Overview Diagram can map the flow:
- Start with Initial Node.
- Flow to an Interaction Node for Cart Validation (Sequence Diagram).
- Decision Node: Is cart valid?
- If Yes: Flow to Payment Gateway (Interaction Node).
- If No: Flow to Error Handler (Interaction Node).
- Join Node: Merge successful payment and error handling paths.
- Final Node: Order Confirmation.
2. Authentication and Authorization
Security flows often involve multiple checks. This diagram helps visualize the sequence of authentication steps.
- Initial Node.
- Interaction Node: User Login.
- Decision Node: Credentials Valid?
- If No: Interaction Node: Lockout Policy.
- If Yes: Interaction Node: Session Creation.
- Decision Node: Permission Check.
- Final Node: Access Granted.
3. Data Synchronization
For systems that sync data across multiple sources, concurrency is key.
- Fork Node splits the flow.
- Parallel Interaction Node: Sync Source A.
- Parallel Interaction Node: Sync Source B.
- Join Node: Wait for both sources.
- Interaction Node: Resolve Conflicts.
- Final Node: Sync Complete.
⚖️ Comparison: Interaction Overview vs. Activity Diagram
It is common to confuse the Interaction Overview Diagram with a standard Activity Diagram. While they share many visual elements, their focus differs significantly.
| Feature | Activity Diagram | Interaction Overview Diagram |
|---|---|---|
| Primary Focus | Workflow and actions | Interaction sequences and control flow |
| Granularity | Can be high-level or detailed actions | Encapsulates detailed interactions within nodes |
| Object Focus | Data movement and state changes | Object communication and message passing |
| Complexity | Good for simple to medium workflows | Best for complex systems with multiple sequences |
| Usage | Business processes, algorithms | Software architecture, API flows |
🚧 Common Pitfalls and Best Practices
Creating effective diagrams requires avoiding common mistakes. Following best practices ensures clarity and utility.
Pitfalls to Avoid
- Overcrowding: Do not place too many interaction nodes in a single diagram. If the diagram becomes too large, split it into sub-diagrams.
- Missing Guards: Every decision node must have an exit path for every possible outcome. Unmarked flows lead to ambiguity.
- Inconsistent Naming: Ensure interaction nodes are named consistently with the underlying sequence diagrams to avoid confusion.
- Ignoring Concurrency: Do not use sequential flows where parallel processing is required. Use Fork and Join nodes correctly.
Best Practices
- Modularity: Treat interaction nodes as modular components. Each should represent a coherent sub-process.
- Documentation: Add notes or comments to explain complex logic or business rules embedded in the flow.
- Review: Have developers review the diagram to ensure the interactions match the actual implementation logic.
- Iterative Design: Start with a high-level overview and add detail to interaction nodes only as needed.
🛑 Handling Exceptions and Errors
Robust systems must handle errors gracefully. The Interaction Overview Diagram is excellent for modeling error paths.
- Exception Nodes: Use specific interaction nodes to represent error handling routines.
- Guard Conditions: Use negative guard conditions (e.g., [Timeout], [Auth Failed]) to route flow to error nodes.
- Retry Logic: You can model loops where a flow returns to a previous interaction node if a retry is successful.
- Cleanup: Ensure there is a path to a final node even after an error, representing system recovery or graceful shutdown.
📈 When to Use This Diagram
Not every system design requires an Interaction Overview Diagram. Knowing when to apply it saves time and reduces complexity.
- Complex Flows: Use it when a standard Activity Diagram becomes too cluttered with message details.
- Multiple Sequences: Use it when the system involves several distinct interaction scenarios that need to be orchestrated.
- Team Collaboration: Use it to show high-level flow to stakeholders who do not need to see every message detail.
- Integration Points: Use it to model how different subsystems communicate during a major process.
🔚 Summary of Key Points
The UML Interaction Overview Diagram serves as a vital tool for architects and developers managing complex system behaviors. By encapsulating detailed interaction diagrams within a control flow structure, it provides clarity without sacrificing depth. Understanding the core elements—Activity Nodes, Interaction Nodes, Control Flows, Forks, and Joins—is essential for effective modeling.
Key takeaways from this breakdown include:
- It combines the flow logic of Activity Diagrams with the detail of Sequence Diagrams.
- Interaction nodes allow for abstraction of complex message exchanges.
- Control flow edges dictate the sequence and logic of the system.
- Proper use of Fork and Join nodes enables accurate representation of parallel processes.
- Comparison with standard Activity Diagrams highlights its specific utility in software interaction modeling.
By adhering to visual standards and avoiding common pitfalls, teams can create models that accurately reflect system behavior. This clarity facilitates better communication among stakeholders and reduces the risk of implementation errors. The Interaction Overview Diagram remains a powerful asset in the UML toolkit for any project requiring structured, detailed interaction planning.

