

Software systems are complex machines composed of numerous interacting parts. To understand how these parts function together, engineers rely on a standardized visual language. Unified Modeling Language (UML) serves as this universal dialect, allowing teams to visualize, specify, construct, and document the artifacts of software systems. Among the various diagram types, Interaction Diagrams stand out for their ability to depict the dynamic behavior of a system. They focus on the flow of messages between objects, revealing how data moves and how logic is executed over time.
While many are familiar with Sequence Diagrams, there exists a powerful, often overlooked tool for handling complex control flows: the Interaction Overview Diagram (IOD). This guide provides a detailed examination of UML Interaction Diagrams, with a specific focus on the Interaction Overview Diagram. We will explore how these tools model object communication, clarify complex workflows, and improve system design without relying on specific software tools.
📊 The Landscape of Interaction Diagrams
UML defines four primary types of interaction diagrams. Each serves a unique purpose depending on the complexity of the communication and the information required. Understanding the distinctions between them is the first step in selecting the right tool for your modeling needs.
| Diagram Type | Primary Focus | Best Used For | Key Visual Element |
|---|---|---|---|
| Sequence Diagram | Time ordering of messages | Linear interactions between objects | Vertical Lifelines |
| Communication Diagram | Structural organization | Highlighting relationships between objects | Numbered Arrows |
| Timing Diagram | Time constraints | Real-time systems with strict deadlines | Time Axis |
| Interaction Overview Diagram | Control flow of interactions | Complex logic, branching, and loops | Activity Nodes + Interaction Frames |
While Sequence and Communication diagrams excel at showing a single thread of execution, they struggle when faced with branching logic, loops, or conditional paths. This is where the Interaction Overview Diagram becomes essential. It acts as a bridge between the high-level logic of Activity Diagrams and the detailed object communication of Sequence Diagrams.
🧩 Deep Dive: Interaction Overview Diagram
An Interaction Overview Diagram is a specialized form of an Activity Diagram. It is designed to show the control flow between different interaction diagrams. Think of it as a map that connects various islands of detailed communication. Each island represents a specific scenario (often modeled in a Sequence Diagram), and the map shows how the system navigates from one scenario to another based on conditions or events.
This diagram type is particularly valuable when:
- You have multiple distinct user flows that need to be visualized together.
- Your system logic involves significant branching (if-else conditions).
- You need to show loops or iterations of a specific interaction.
- Complex error handling paths need to be documented alongside happy paths.
Key Components of an Interaction Overview Diagram
To construct a valid IOD, you must understand the building blocks. These elements allow you to blend the structure of activity diagrams with the semantics of interaction diagrams.
- Interaction Frame: This is the container. It looks like a rectangle with a label in the top-left corner (e.g., “<
> Login Sequence”). Inside this frame, you place the actual sequence or communication diagram details. This encapsulates the complexity of the interaction within a single node. - Control Flow: These are the standard arrows used in activity diagrams. They indicate the order of execution. An arrow from one Interaction Frame to another implies that the first interaction must complete before the second begins.
- Object Flow: In some contexts, data might pass from one interaction to another. Object flows represent the movement of specific objects or data values between frames.
- Junctions: These are diamond-shaped nodes. They represent decision points or merge points. A decision node has one input and multiple outputs, each labeled with a guard condition (e.g., [Valid] or [Invalid]).
- Initial Node: The starting point of the diagram, typically a solid black circle.
- Final Node: The end point, typically a circle with a dot inside (a bullseye).
🔄 Combining IODs with Sequence Diagrams
The true power of the Interaction Overview Diagram lies in its ability to nest other interaction diagrams. You do not draw every single message in the IOD itself. Instead, you create a Sequence Diagram for a specific sub-process and embed that Sequence Diagram inside an Interaction Frame within the IOD.
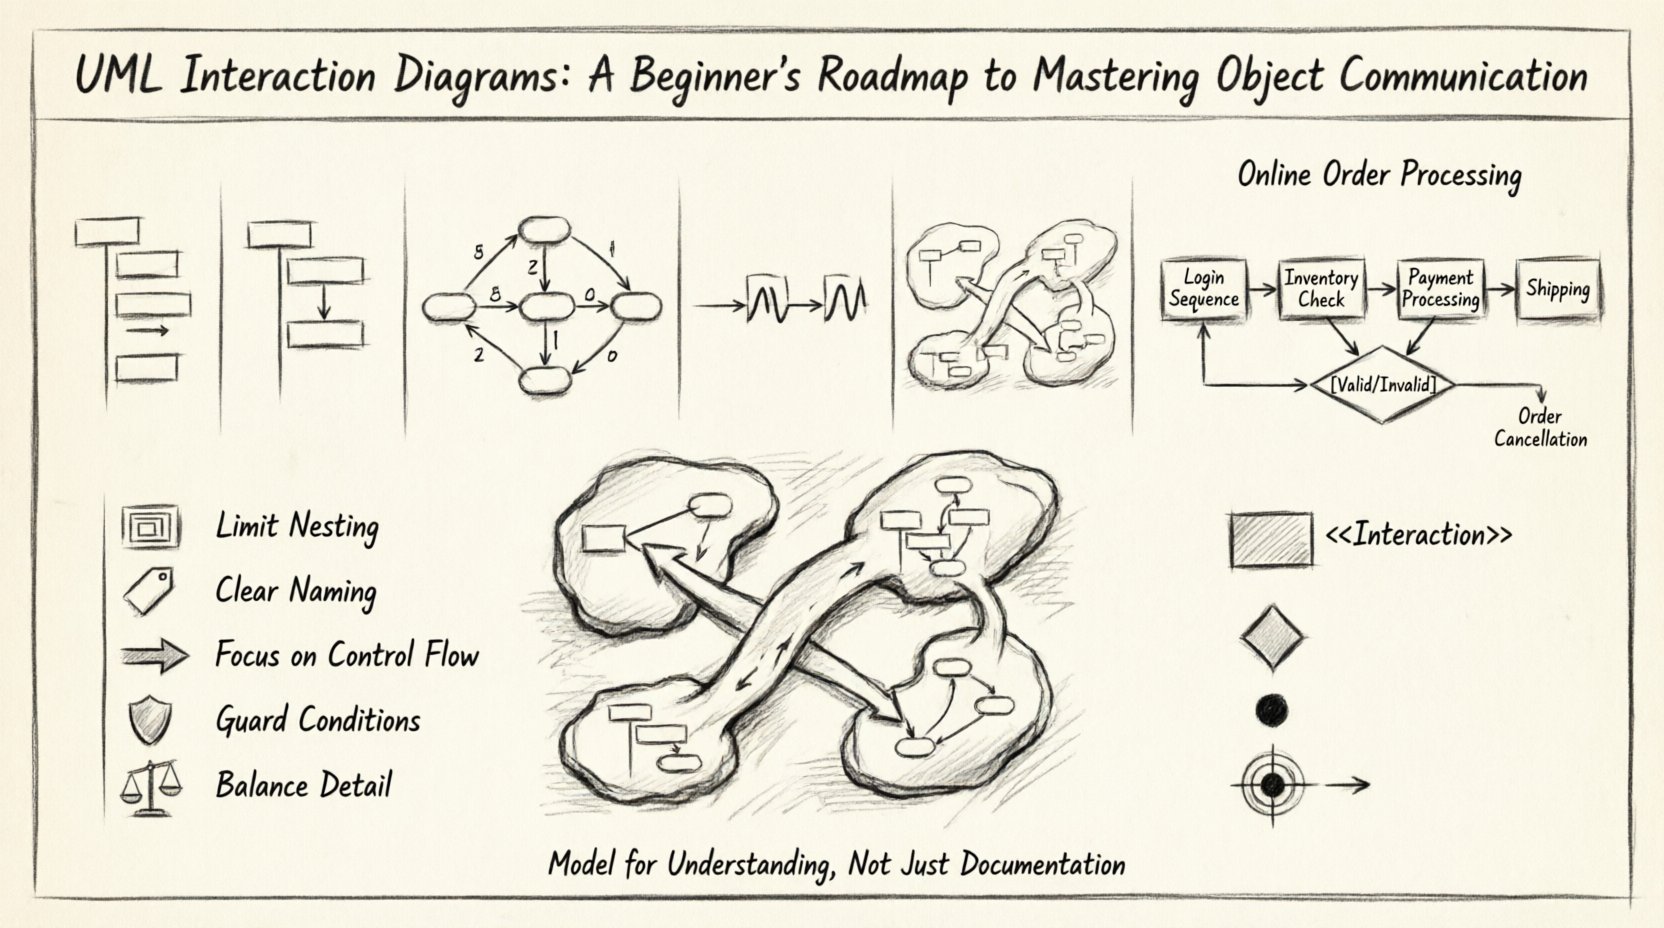
Consider a scenario involving an online order processing system. The process is not linear. It involves:
- Validating the user session.
- Checking inventory.
- Processing payment.
- Handling shipping.
If you try to draw this as one giant Sequence Diagram, the vertical lifelines become crowded, and the horizontal space becomes impossible to manage. The IOD solves this by breaking the process down:
- Node 1: An Interaction Frame containing the “Login Sequence” diagram.
- Decision Node: Checks if the session is valid.
- Node 2: An Interaction Frame containing the “Inventory Check Sequence” diagram.
- Node 3: An Interaction Frame containing the “Payment Processing Sequence” diagram.
Arrows connect these nodes, showing the logical progression. If the inventory check fails, an arrow directs the flow to an “Order Cancellation Sequence” frame. This separation of concerns makes the system architecture much clearer.
🎯 When to Choose Interaction Overview Diagrams
Choosing the right diagram is crucial for effective communication. Using an IOD when a simple Sequence Diagram would suffice adds unnecessary complexity. Conversely, using a Sequence Diagram for a complex workflow leads to a “spaghetti diagram” that is difficult to read. Here are specific scenarios where the IOD is the superior choice.
1. Complex Decision Logic
When your system requires multiple conditional branches, a Sequence Diagram becomes cluttered with decision diamonds scattered across the lifelines. An IOD allows you to visualize these decisions at the macro level, keeping the internal details of each branch contained within their respective frames.
2. Reusable Interaction Patterns
If several parts of your system follow the same interaction pattern (e.g., a standard “Save Data” flow), you can create one Sequence Diagram and reference it in multiple places within an IOD. This reduces redundancy and ensures consistency across your documentation.
3. High-Level Workflow Visualization
For stakeholders who need to understand the big picture without getting bogged down in every method call, the IOD provides a perfect abstraction. It shows the sequence of major operations without displaying the low-level message exchanges.
4. Parallel Processing
Modern systems often handle tasks concurrently. While standard Sequence Diagrams struggle to show parallelism clearly, IODs can utilize Fork/Join nodes to indicate where multiple interaction flows happen simultaneously.
🛠️ Best Practices for Designing Interaction Overviews
To ensure your diagrams remain readable and useful, adhere to established design principles. A diagram that is too complex defeats the purpose of modeling.
- Limit Nesting Depth: Avoid nesting interaction frames within frames. If an interaction frame becomes too complex, extract it into a separate IOD or Sequence Diagram and reference it. Keep the hierarchy shallow.
- Consistent Naming: Name your frames clearly. Use names that reflect the specific scenario, such as “<
> Create Account” rather than just “Frame 1”. - Focus on Control Flow: Do not attempt to model every data variable passing between frames. Stick to the control logic. If data flow is critical, document it in the detailed Sequence Diagrams inside the frames.
- Use Guard Conditions Clearly: When using decision nodes, ensure the labels (e.g., [Success], [Error]) are unambiguous. They should reflect the outcome of the interaction inside the frame.
- Balance Detail: Ensure the interaction frames contain enough detail to be meaningful but not so much that they cannot be viewed at a glance. If a frame requires a scroll to read, it is likely too large.
⚠️ Common Pitfalls to Avoid
Even experienced modelers can fall into traps when designing interaction diagrams. Being aware of these common mistakes can save significant time during reviews.
- Mixing Concerns: Do not mix control flow logic with data flow logic in the same diagram unless necessary. Keep the IOD focused on the order of operations.
- Ignoring State: Interaction diagrams show behavior, but they do not explicitly show state changes. Ensure your team understands that the state of an object is implied by the messages sent, not explicitly drawn in the IOD.
- Over-fragmentation: Breaking the process into too many tiny frames makes the diagram look like a flowchart rather than a system model. Group related interactions together.
- Missing Error Paths: A common oversight is only modeling the “Happy Path.” Always include at least one error or exception path in your IOD to demonstrate robustness.
- Unclear Transitions: Ensure every arrow has a clear destination. Orphaned arrows or loops without exit conditions confuse readers.
🔄 Integration with Other Modeling Efforts
An Interaction Overview Diagram does not exist in isolation. It is part of a larger ecosystem of diagrams that define the system architecture. Understanding how it fits into the broader picture is vital for coherent design.
- Class Diagrams: The objects referenced in your IOD frames must exist in your Class Diagram. Ensure the lifelines in your nested Sequence Diagrams correspond to actual classes in your structure model.
- State Machine Diagrams: If an object has complex internal states, a State Machine Diagram might run parallel to your IOD. The IOD shows how objects talk, while the State Machine shows how an object behaves internally.
- Use Case Diagrams: Use Cases describe *what* the system does from a user perspective. Interaction Diagrams describe *how* the system does it. You can trace a Use Case to an IOD to understand the underlying mechanics.
📝 Frequently Asked Questions
Can I use Interaction Overview Diagrams for data modeling?
No. IODs are behavioral diagrams. They focus on the flow of messages and control logic. For data structure, use Class Diagrams or Entity-Relationship Diagrams.
Is an IOD better than an Activity Diagram?
It depends. If your focus is on high-level business processes involving people and tools, an Activity Diagram is better. If your focus is on the specific communication between software objects, an IOD is better because it preserves the object-oriented semantics.
Do I need to draw every interaction?
No. The IOD allows you to abstract. You can represent a whole sequence of messages as a single frame. Only the detailed Sequence Diagram inside the frame needs to show every message.
How do I handle loops in an IOD?
Use a Loop Frame or a decision node with a back-arrow to a previous interaction frame. This indicates that a specific interaction repeats until a condition is met.
🌟 Final Thoughts on System Communication
Modeling object communication is a fundamental skill in software engineering. It transforms abstract requirements into concrete blueprints that developers can follow. The Interaction Overview Diagram offers a unique perspective, allowing architects to navigate complex logic without losing the detail of object interactions.
By combining the structural clarity of Activity Diagrams with the semantic precision of Sequence Diagrams, IODs provide a robust way to document system behavior. Whether you are designing a simple web application or a distributed enterprise system, mastering these diagrams leads to cleaner code, fewer bugs, and better team alignment.
Start by identifying your complex workflows. Try mapping them using Interaction Overview Diagrams to see if the clarity improves. Remember, the goal of modeling is understanding, not just documentation. Use these tools to clarify your thinking and communicate your vision effectively.

