Creating a clear blueprint for system behavior requires more than just listing actions. It demands a structured view of how different parts of a system communicate and control one another. The Interaction Overview Diagram (IOD) serves this purpose perfectly. It combines the control flow of an Activity Diagram with the detailed communication logic found in Sequence Diagrams. This guide walks through the process of building a robust model from scratch, ensuring clarity and precision in your design documents. 🎯
Understanding the Interaction Overview Diagram 🧠
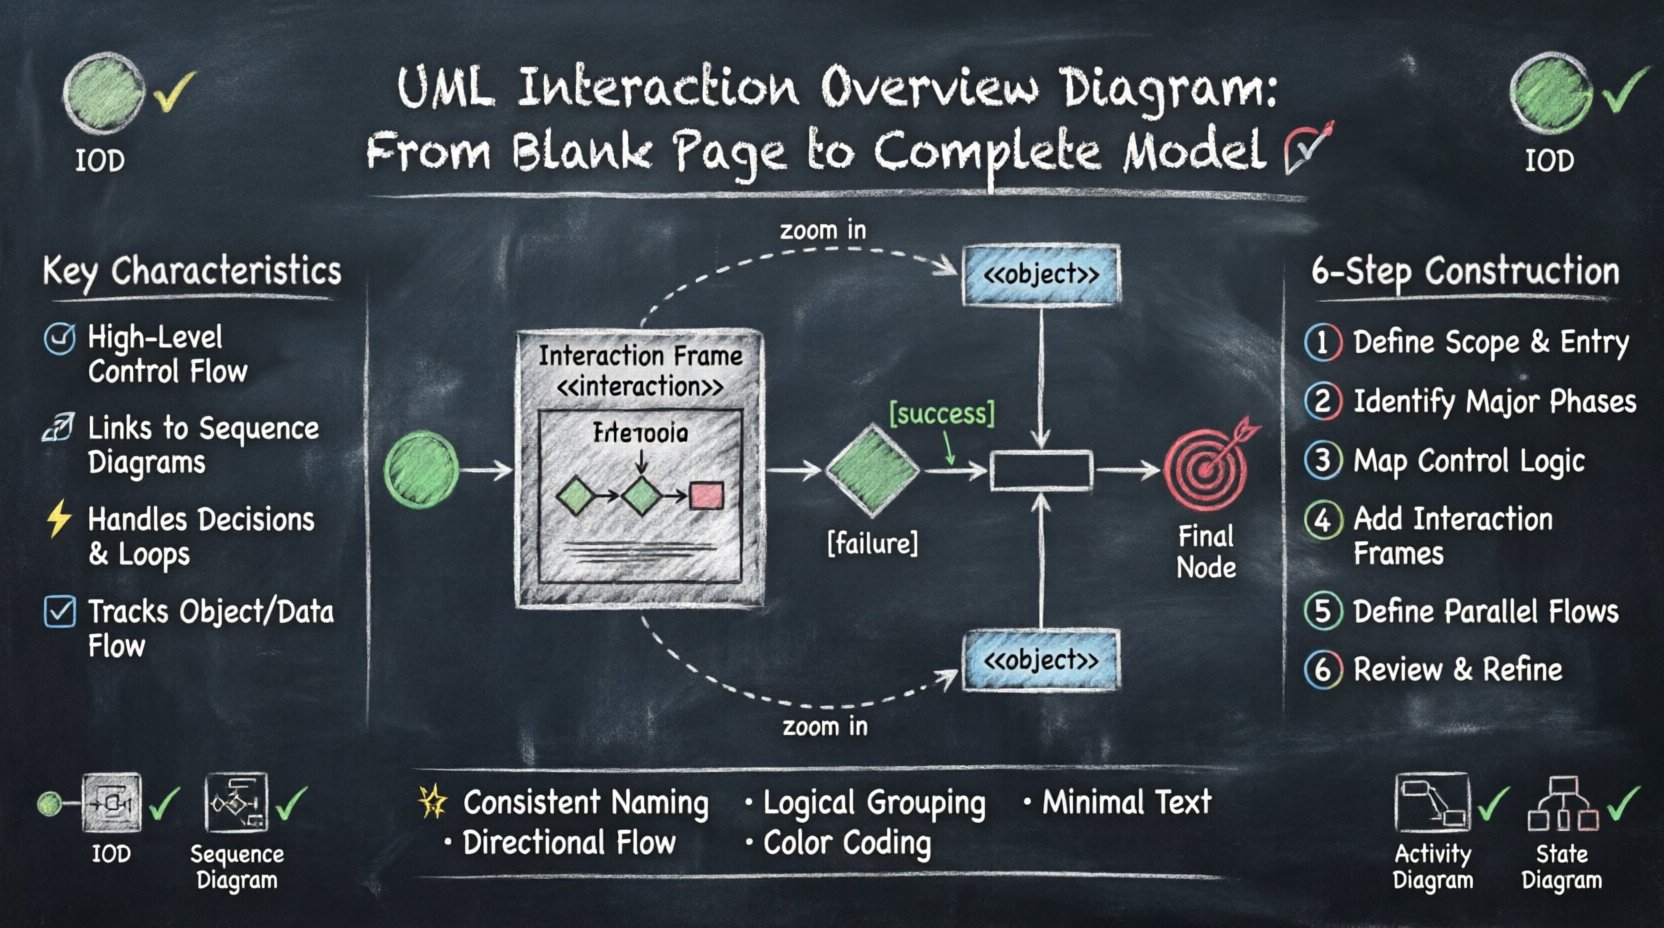
An Interaction Overview Diagram is a specialized type of UML diagram that shows the flow of control and data between objects or actors. Unlike a standard Activity Diagram, which focuses on the sequence of activities, the IOD integrates interaction frames. These frames encapsulate other diagrams, typically Sequence Diagrams or Communication Diagrams. This nesting capability allows designers to zoom in on specific interactions without cluttering the high-level flow.
Key characteristics include:
- High-Level Control: It defines the order of operations.
- Integration: It links to detailed interaction diagrams.
- Decision Points: It handles conditional logic and loops.
- Object Flow: It tracks the passing of data objects between steps.
When starting a project, the IOD helps stakeholders understand the big picture before diving into the minutiae of message passing. It bridges the gap between abstract workflow and concrete implementation details.
Core Elements and Notation 🛠️
To construct a valid diagram, one must understand the standard symbols. Each symbol carries specific semantic meaning regarding control flow, data transfer, or interaction encapsulation.
1. Initial and Final Nodes 🟢🔴
The process begins with an Initial Node, typically represented as a solid circle. This marks the entry point of the interaction flow. Similarly, a Final Node indicates the successful termination of the process. It is important to note that a system can have multiple final nodes if there are multiple ways for a process to conclude, such as success or cancellation.
2. Control Nodes ⚙️
Control nodes manage the flow of execution. They do not represent data objects but rather the logic that directs the process.
- Decision Node: A diamond shape representing a fork in the road. It has one incoming edge and multiple outgoing edges, each guarded by a condition.
- Fork Node: A thick horizontal bar that splits the flow into parallel threads. This indicates concurrent execution paths.
- Join Node: A thick horizontal bar that merges parallel threads back into a single flow. All incoming threads must complete before the flow continues.
- Interruptible Region: A frame that can be interrupted by an event, allowing for exception handling logic.
3. Object Nodes 📦
While control nodes move the process forward, object nodes represent the data or state being passed. These are depicted as rectangles with the stereotype <<object>> or simply a rectangle. They are crucial for showing what information is available at each step of the interaction.
4. Interaction Frames 🖼️
This is the defining feature of the IOD. A frame is a rectangular box that encapsulates a Sequence Diagram. It is labeled with the stereotype <<interaction>>. The frame acts as a single activity in the IOD flow, but clicking or expanding it reveals the detailed message exchanges.
Comparing IOD with Other UML Diagrams 📊
Selecting the right tool for the job is essential for effective modeling. Below is a comparison to clarify when to use an Interaction Overview Diagram versus other common UML artifacts.
| Diagram Type | Primary Focus | Best Used For |
|---|---|---|
| Interaction Overview Diagram | Control flow and high-level interaction | Orchestrating complex workflows involving multiple subsystems |
| Sequence Diagram | Time-ordered message exchange | Detailing specific communication between two or more objects |
| Activity Diagram | Business logic and algorithm steps | Modeling the logic of a single process without external interaction details |
| State Machine Diagram | Object lifecycle and state transitions | Modeling how an object reacts to events over time |
Using an IOD is preferable when the complexity lies in the coordination of different sequence diagrams. If you only have one sequence of events, a Sequence Diagram suffices. If the logic is purely procedural without external dependencies, an Activity Diagram is better. The IOD shines in scenarios requiring orchestration.
Step-by-Step Construction Guide 🚀
Building a model from a blank page requires a methodical approach. Follow these steps to ensure a logical and maintainable structure.
Step 1: Define the Scope and Entry Point 🎯
Before drawing lines, identify the trigger for the interaction. What event starts this process? Is it a user login, a scheduled task, or an incoming API request? Place the Initial Node on the canvas to represent this trigger. Define the expected outcome clearly. This anchors the diagram and prevents scope creep.
Step 2: Identify Major Phases 🏗️
Break the process down into high-level phases. These phases become the activities in your IOD. For example, in a payment system, phases might include “Validate User,” “Process Payment,” and “Generate Receipt.” Place these as rectangular nodes between the initial and final nodes.
Step 3: Determine Control Logic 🧭
Map out the decision points. Where does the system need to choose between paths? Insert Decision Nodes where conditions apply. For instance, if a payment fails, the flow must divert to a retry or cancellation path. Use guards on outgoing edges to specify conditions, such as [success] or [failure].
Step 4: Integrate Interaction Frames 🔗
For each complex phase, create a corresponding Sequence Diagram. Then, encapsulate that Sequence Diagram within an Interaction Frame on the IOD. Replace the simple activity node with the Interaction Frame. This links the high-level flow to the detailed message exchange.
Ensure that the inputs and outputs of the frame match the surrounding object nodes. This maintains data consistency across the model.
Step 5: Define Parallel Flows ⚡
Identify operations that can happen simultaneously. Use Fork Nodes to split the flow into parallel paths. Ensure that these paths are eventually joined using Join Nodes to synchronize the process. This is common in systems where multiple validations must run at once before proceeding.
Step 6: Review and Refine 🔍
Walk through the diagram from start to finish. Check for unreachable nodes or orphaned edges. Ensure every decision point has a defined path for all possible outcomes. Verify that all interaction frames are properly labeled and linked.
Practical Application Scenarios 💼
Understanding the theory is one thing; applying it is another. Here are specific scenarios where an IOD adds significant value.
- Microservice Orchestration: When a request triggers multiple backend services, an IOD can show the sequence of calls and error handling logic without detailing every message.
- Workflow Automation: In business processes involving human intervention and automated steps, the IOD clarifies where the system waits and where it acts.
- API Gateway Logic: For APIs that route requests based on headers or parameters, the IOD illustrates the routing decisions and the subsequent service calls.
- Complex Error Handling: When a process has multiple failure modes, the IOD maps out the recovery paths clearly, showing where the system retries, logs, or aborts.
Common Mistakes and How to Avoid Them ⚠️
Even experienced modelers encounter pitfalls. Awareness of common errors helps maintain diagram quality.
| Mistake | Impact | Correction Strategy |
|---|---|---|
| Overloading Frames | Frames become too large to read | Break complex interactions into smaller, reusable frames |
| Ignoring Data Flow | Logic exists but data is missing | Ensure Object Nodes connect to every relevant activity |
| Unbalanced Forks | Deadlocks or infinite waits | Ensure every Fork has a corresponding Join |
| Missing Guards | Ambiguous decision paths | Label every outgoing edge from a Decision Node |
| Deep Nesting | Loss of context | Limit nesting depth to two levels for readability |
One frequent issue is creating frames that contain too much detail. An Interaction Frame should represent a cohesive interaction. If a frame requires its own interaction overview to make sense, it is too complex. Simplify the interaction within the frame.
Integrating IOD into Your Workflow 🔄
Incorporating this diagram type into your development lifecycle requires planning. It should not be an afterthought.
1. Design Phase 📝
Use the IOD during the system design phase. It helps architects visualize the flow of control across modules. This is the time to define the boundaries of interaction frames.
2. Implementation Phase 💻
Developers can reference the IOD to understand the context of their code. If a module is part of an interaction frame, the developer knows how that module fits into the broader sequence.
3. Testing Phase 🧪
Testers use the IOD to derive test cases. Every decision node represents a condition to test. Every interaction frame represents a scenario to validate end-to-end.
4. Documentation Phase 📚
The IOD serves as high-level documentation for maintenance teams. It provides a map of the system’s behavior without requiring deep knowledge of every line of code.
Best Practices for Clarity ✨
To ensure your diagrams are effective, adhere to these guidelines.
- Consistent Naming: Use the same terminology for nodes and frames across all diagrams. Avoid synonyms for the same concept.
- Logical Grouping: Group related activities together spatially. This reduces the visual noise of crossing lines.
- Minimal Text: Keep labels concise. Move detailed explanations to the interaction frames or accompanying documentation.
- Directional Flow: Maintain a top-to-bottom or left-to-right flow. Avoid crossing lines where possible.
- Color Coding: If your tool supports it, use color to distinguish between different types of nodes or data flows. However, ensure black and white printing remains readable.
Advanced Techniques: Reusable Frames 🧩
As systems grow, you will find yourself repeating interaction patterns. Instead of creating a new frame for every occurrence, create a reusable interaction definition. This is similar to a function in programming.
Define the interaction once in a separate diagram. Reference it from multiple locations in your IOD. This reduces redundancy and ensures consistency. If the interaction logic changes, you update the definition, and all references update logically.
Final Considerations 🔚
Modeling complex systems is an iterative process. An Interaction Overview Diagram is not a one-time artifact; it evolves with the system. Regular reviews are necessary to keep it aligned with the actual implementation. As features are added or removed, the diagram must reflect these changes.
The value of the IOD lies in its ability to provide a single view of control flow while maintaining the detail of message sequences when needed. By following these guidelines, you can create models that are both comprehensive and understandable. Focus on clarity, accuracy, and maintainability. This approach ensures that your documentation serves its purpose as a reliable guide for development and maintenance tasks.
Remember that the goal is communication. A diagram that is technically correct but unreadable fails its primary purpose. Prioritize the needs of your audience, whether they are developers, testers, or business stakeholders. With practice, constructing these models becomes a natural part of the design process.

