Customer journey mapping has transitioned from a theoretical exercise to a fundamental business imperative. It is the practice of visualizing the end-to-end experience a person has with a brand. This visualization is not merely about drawing lines on a whiteboard; it is about understanding the emotional, cognitive, and behavioral shifts a customer undergoes from initial awareness to long-term advocacy. Organizations that implement this discipline effectively do not just see higher conversion rates; they see deeper loyalty and reduced operational friction.
This article examines concrete examples of how diverse industries have leveraged customer journey mapping to solve complex problems. We will dissect the methodologies, the specific pain points addressed, and the tangible outcomes achieved. The focus remains on the strategic application of insights rather than the tools used to generate them.
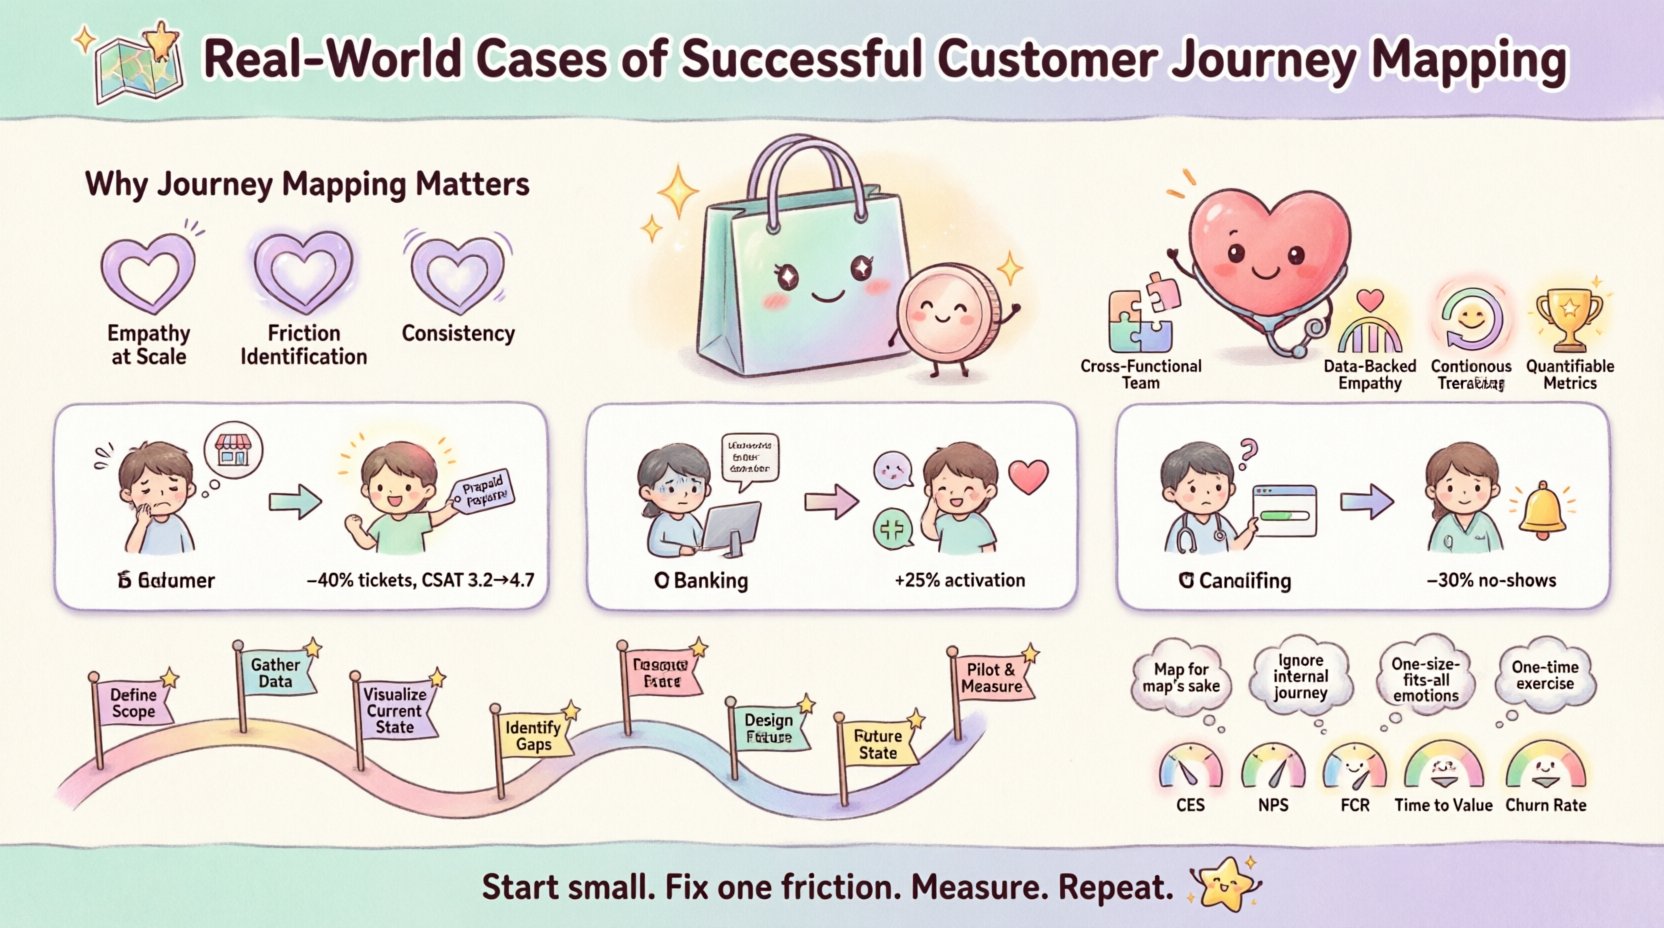
🔍 Why Journey Mapping Matters in Modern Business
Before analyzing specific cases, it is necessary to understand the underlying mechanism of value. A customer journey map serves as a shared artifact across departments. It aligns marketing, sales, support, and product development around a single narrative of the user.
- Empathy at Scale: It forces stakeholders to step outside their functional silos and view the experience through the eyes of the customer.
- Friction Identification: It highlights where users drop off, get confused, or feel frustrated.
- Consistency: It ensures the brand promise made in advertising is delivered in the service interaction.
Without this map, organizations often optimize for their own internal efficiency rather than customer convenience. The cases below illustrate the shift from internal-centric to customer-centric operations.
🏪 Case Study 1: Global Retailer – Reducing Post-Purchase Friction
A major international retailer faced a significant challenge with their returns process. While the initial purchase was seamless, the post-purchase phase was riddled with confusion. Customers did not know how to initiate a return, what the timeline was, or where to send items. This led to a high volume of support calls and negative sentiment.
🛠 The Mapping Process
The organization formed a cross-functional team including logistics, customer service, and digital experience leads. They mapped the “Returns and Exchanges” journey starting from the moment the customer decided they wanted an item back.
- Phase 1: Awareness. Where did customers look for return instructions? (Packaging, email confirmation, website footer).
- Phase 2: Action. How did they initiate the request? (Manual form, portal, call center).
- Phase 3: Fulfillment. How did they send the item? (Drop-off, pickup, courier).
- Phase 4: Resolution. How long did the refund take to appear?
💡 Key Insights Discovered
The map revealed that the primary pain point was not the cost of shipping, but the lack of clarity regarding the “why” and “how.” Customers feared hidden fees and lost packages. The process required too many clicks to find a QR code for drop-off.
🚀 The Solution & Outcome
The retailer restructured the return flow. They introduced a self-service portal where the order number was sufficient to generate a prepaid label immediately. They also integrated SMS updates at every stage of the return.
- Result: Support ticket volume regarding returns dropped by 40%.
- Result: Customer Satisfaction Score (CSAT) for the returns process increased from 3.2 to 4.7.
- Result: Repeat purchase rate within 90 days of a return increased by 15%.
This case demonstrates that mapping a negative or transactional touchpoint can yield higher loyalty than a standard positive sales interaction. By removing friction from the worst part of the experience, the overall brand perception improved significantly.
🏦 Case Study 2: Digital Banking – Streamlining Onboarding
A fintech startup struggled with low activation rates. Users would sign up for an account but never fund it or link a card. The drop-off rate during the account verification stage was alarming. The business assumed users were not interested, but the journey map suggested otherwise.
🛠 The Mapping Process
The team focused on the “Account Activation” journey. They tracked every interaction from the landing page to the first deposit. They interviewed users who had dropped off to understand their hesitation.
- Touchpoint 1: Mobile App Download.
- Touchpoint 2: Identity Verification (KYC).
- Touchpoint 3: Card Linking.
- Touchpoint 4: First Transaction.
💡 Key Insights Discovered
The map highlighted a critical friction point during Identity Verification. The process required uploading multiple documents (ID, utility bill, proof of address). Many users found this intrusive and time-consuming. Furthermore, the error messages were generic, offering no guidance on how to correct a rejected image.
Additionally, the timeline between verification and account readiness was unclear. Users felt the process was broken because they received no status updates.
🚀 The Solution & Outcome
The bank simplified the verification requirements where legally permissible. They implemented real-time validation for document uploads, providing specific feedback (e.g., “Image too dark,” “Corner cut off”) rather than a generic “Upload Failed.” They also added a progress bar to show users exactly how many steps remained.
- Result: Account activation rate increased by 25%.
- Result: Average time to first transaction decreased from 4 days to 1 day.
- Result: Trust metrics improved, with fewer complaints about “lost” applications.
This example underscores that speed and clarity are often more valuable than feature richness in the early stages of a relationship. Removing ambiguity builds the trust required for financial services.
🏥 Case Study 3: Healthcare Provider – Enhancing Patient Navigation
A regional healthcare network faced issues with patient no-shows and low satisfaction scores regarding appointment scheduling. Patients felt lost navigating the system, from booking the initial visit to understanding post-visit care instructions.
🛠 The Mapping Process
The team mapped the “Patient Care Lifecycle.” This journey extended beyond the clinical visit to include pre-appointment communication, the visit itself, and post-discharge follow-up. They engaged patient advocates to walk them through the process.
- Phase 1: Scheduling. How easy is it to find a slot?
- Phase 2: Preparation. Do patients know what to bring or how to prepare?
- Phase 3: The Visit. Wait times, provider interaction, billing clarity.
- Phase 4: Follow-up. Access to results and next steps.
💡 Key Insights Discovered
The map revealed that anxiety peaked at two specific moments: booking the appointment and waiting for test results. The scheduling system was fragmented across phone lines and a website that did not sync in real-time. Furthermore, patients received test results via a portal they did not know existed, leading to confusion and missed health interventions.
🚀 The Solution & Outcome
The provider unified the scheduling interface to show real-time availability. They introduced automated, empathetic reminders that included preparation instructions based on the specific type of appointment. They also created a dedicated “Results Navigator” role to ensure patients understood their reports without relying solely on the technical portal.
- Result: No-show rates decreased by 30%.
- Result: Patient reported experience scores rose to the top quartile for the region.
- Result: Clinical adherence to follow-up plans improved.
Here, the journey map served a humanitarian purpose as well as a business one. By reducing the cognitive load on patients during stressful times, the organization delivered superior care.
📊 Common Elements of Success Across Cases
While the industries differ, the successful implementations share specific structural characteristics. The following table summarizes the critical success factors observed in these scenarios.
| Factor | Description | Impact |
|---|---|---|
| Cross-Functional Ownership | The map is not owned by one department (e.g., Marketing). It is a shared responsibility. | Breaks down silos and ensures end-to-end accountability. |
| Data-Backed Empathy | Insights are derived from actual user behavior data and direct feedback, not assumptions. | Ensures the map reflects reality, not internal bias. |
| Emotional Tracking | The map includes a line for user sentiment (frustrated, confident, anxious) alongside actions. | Highlights emotional triggers that drive churn or loyalty. |
| Continuous Iteration | The map is treated as a living document, updated as the business or market changes. | Prevents the map from becoming obsolete quickly. |
| Quantifiable Metrics | Every change made to the journey is tied to a specific KPI (NPS, CES, Retention). | Allows for clear measurement of ROI. |
🛠️ Implementing Your Own Journey Mapping Initiative
Replicating these successes requires a disciplined approach. There is no magic button, but there is a proven methodology to follow.
1. Define the Scope and Persona
Do not attempt to map every possible journey at once. Start with one high-value or high-friction persona. For example, a “First-Time Shopper” or a “Patient with Chronic Conditions.” Narrowing the scope allows for deeper analysis.
2. Gather Qualitative and Quantitative Data
Combine hard data (analytics, drop-off rates) with soft data (user interviews, support transcripts). Quantitative data tells you what is happening; qualitative data tells you why.
- Analytics: Look for drop-off points in digital flows.
- Interviews: Ask users to narrate their experience aloud while performing tasks.
- Support Logs: Analyze recurring complaints to find systemic pain points.
3. Visualize the Current State (As-Is)
Create a visual representation of the journey as it exists today. Include channels (phone, web, in-person), actions, thoughts, and emotions. Do not simplify this too early. The goal is to see the messiness of the current reality.
4. Identify Gaps and Opportunities
Compare the “As-Is” map against the ideal customer experience. Where are the gaps? Where does the user have to work too hard? Where is the information missing? This is where the strategy is formulated.
5. Design the Future State (To-Be)
Redesign the journey to eliminate friction. This might involve changing a process, rewriting copy, or reorganizing a team. Ensure that the new flow is feasible within current operational constraints.
6. Pilot and Measure
Implement changes in a controlled environment. Measure the impact against the metrics defined in step 1. If the metric improves, scale. If not, return to the mapping phase.
📏 Measuring Success: Beyond Vanity Metrics
When evaluating the effectiveness of journey mapping initiatives, avoid focusing solely on top-line revenue. While revenue is important, journey improvements often show up in efficiency and sentiment first.
- Customer Effort Score (CES): Measures how easy it is for a customer to get things done. Lower effort correlates with higher loyalty.
- Net Promoter Score (NPS): Indicates the likelihood of recommendation. Good for overall sentiment tracking.
- First Contact Resolution (FCR): Measures if the customer gets their issue solved immediately without needing to call back.
- Time to Value: How long it takes for a new user to realize the benefit of your product or service.
- Churn Rate: The ultimate test of whether the journey is sustainable over time.
It is vital to track these metrics over time. A single snapshot does not tell the whole story. Trends provide the true signal of whether the journey is improving.
⚠️ Common Pitfalls to Avoid
Many organizations attempt journey mapping and fail to see results. Understanding what goes wrong is as important as knowing what works.
- Creating a Map for the Map’s Sake: If the document sits on a server and no one acts on it, it is a waste of time. Action is required immediately after mapping.
- Ignoring the Internal Journey: Employees cannot deliver a great customer experience if their internal workflow is broken. Map the employee experience (EX) alongside the customer experience (CX).
- Assuming One Journey Fits All: A VIP customer has a different journey than a budget customer. Segmentation is crucial for accuracy.
- Skipping the Emotional Layer: Focusing only on steps and touchpoints ignores the feelings associated with them. Emotions drive memory and decision-making.
- One-Time Exercise: Markets change. Products evolve. A journey map created two years ago may no longer reflect reality.
🔗 Integrating Insights Across the Organization
The most difficult part of journey mapping is often not the creation, but the distribution. The insights must reach the people who can act on them.
- For Product Teams: Share the friction points in the digital onboarding flow to prioritize feature development.
- For Sales Teams: Share the objections and hesitations identified during the awareness phase to refine pitch decks.
- For Support Teams: Share the common confusion points to update knowledge bases and scripts.
- For Leadership: Share the aggregate sentiment data to justify budget allocations for CX improvements.
When the map becomes a shared language, the organization moves faster. Decisions are no longer debated based on opinion; they are debated based on the evidence presented in the journey.
🌱 Final Considerations
The transition to a customer-centric organization is not a destination; it is a continuous process. The cases presented here show that when businesses invest in understanding the human behind the transaction, they reap rewards that extend far beyond the immediate sale. Whether it is a retailer simplifying a return, a bank securing trust, or a clinic improving health outcomes, the mechanism is the same: deep observation and disciplined action.
Start small. Pick one journey. Map it deeply. Find one friction point. Fix it. Measure the impact. Then move to the next. This incremental approach builds momentum and creates a culture where the customer’s perspective is always the guiding principle. The goal is not perfection, but progress. As the landscape shifts, so must your understanding of the customer. Stay curious, stay data-driven, and keep the journey in focus.

