Welcome to the world of user experience design. One of the most powerful tools in your toolkit is the Customer Journey Map. This visual artifact tells the story of a user’s interaction with your product or service. It moves beyond simple wireframes to capture feelings, pain points, and context. This guide is designed to help you build these maps with precision and empathy. We will explore the process, the components, and the common mistakes to avoid. Let us begin.
🧐 Understanding the Core Concept
A journey map is not merely a flowchart or a process diagram. While those tools show what a user clicks, a journey map shows what a user feels and thinks at every stage. It is a holistic view of the experience from the user’s perspective. It connects the dots between various touchpoints and channels.
Think of it as a narrative. It answers the question: “How does it feel to interact with us?”. For a new UX professional, understanding this distinction is critical. A flowchart tells you the logic; a journey map tells you the human reality.
Why This Matters in UX Design
Building maps serves several vital functions within a design team and the organization at large:
- Shared Understanding: It aligns stakeholders. Everyone sees the same story, reducing friction in decision-making.
- Empathy Generation: It forces the team to step into the user’s shoes. Designers stop thinking about features and start thinking about outcomes.
- Gap Identification: It highlights where the experience breaks down. You can see where support is lacking or where friction is high.
- Strategic Planning: It helps prioritize efforts. You can see which parts of the journey have the most impact on the overall goal.
🛠️ Preparing Your Foundation
Before you draw a single line, you need to prepare. A map built on assumptions is a map built on sand. You must gather evidence to support your narrative. This phase is about research and gathering data.
1. Define the Scope
Not every journey needs a map for every user. You must define the boundaries. Are you mapping the entire lifecycle from discovery to advocacy? Or just the onboarding process? Narrowing the scope ensures the map remains actionable.
- Persona: Who are we mapping for? Select one primary persona. Trying to map everyone leads to a map that represents no one.
- Goal: What is the user trying to achieve? Is it buying a product? Solving a technical issue? Receiving a service?
- Timeline: Does the journey happen in minutes, days, or months? The timeline dictates the granularity of the map.
2. Gather Qualitative and Quantitative Data
You need a mix of hard numbers and soft stories. This combination provides a complete picture.
- Quantitative: Analytics data, survey results, and conversion rates. These tell you what users are doing.
- Qualitative: Interviews, diary studies, and usability testing. These tell you why users are doing it and how they feel.
3. Assemble the Team
Journey mapping is a collaborative effort. Do not work in isolation. Involve people from customer support, sales, marketing, and engineering. Each department holds a piece of the puzzle. Their input ensures the map reflects the reality of the business, not just the ideal version.
📝 The Step-by-Step Process
Creating the map is a structured exercise. Follow these steps to ensure a logical flow and comprehensive coverage.
Step 1: Outline the Phases
Break the journey down into chronological stages. While every journey is unique, common phases include:
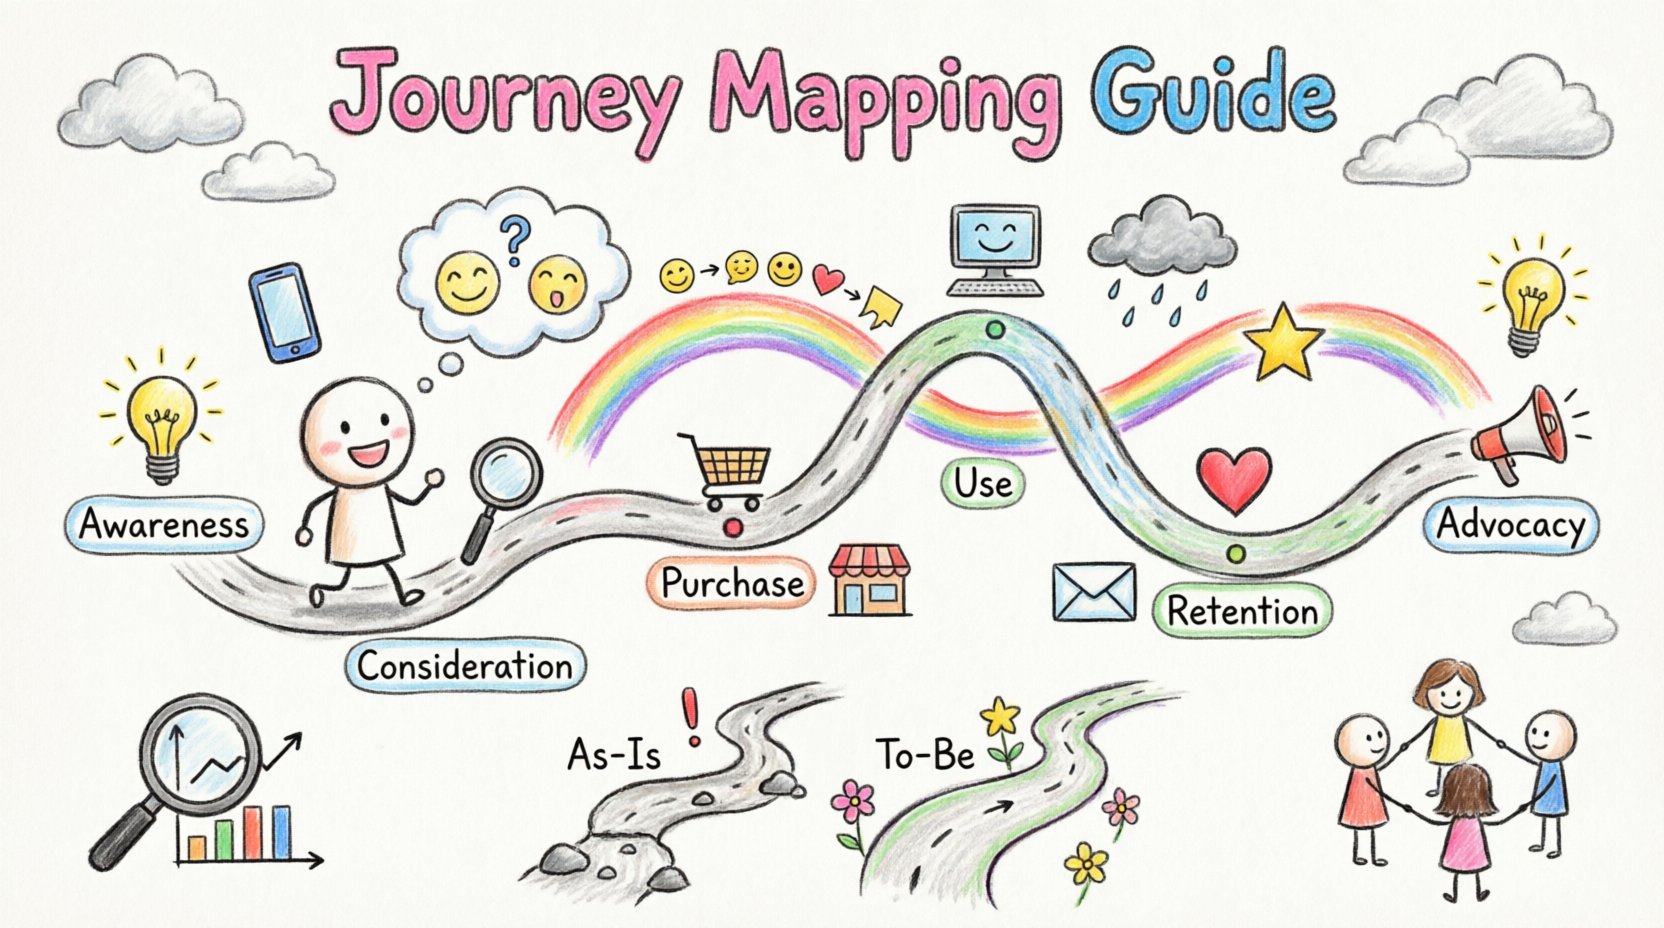
- Awareness: The user realizes they have a problem or need.
- Consideration: The user looks for solutions and compares options.
- Purchase/Adoption: The user makes the decision to engage.
- Use: The user interacts with the product or service.
- Retention: The user continues to engage over time.
- Advocacy: The user recommends the product to others.
Step 2: Map Actions and Touchpoints
For each phase, list the specific actions the user takes. Then, identify the touchpoints. A touchpoint is any point of contact between the user and the organization.
- Channels: Is this happening on a mobile app, a website, in a physical store, or over the phone?
- Interactions: Does the user click a button, talk to a support agent, or receive an email?
Step 3: Document Thoughts and Feelings
This is the most critical part of the map. What is the user thinking at this moment? Are they excited, frustrated, confused, or relieved? You can plot this as a line graph showing emotional highs and lows.
- Thoughts: “Is this secure?” “Can I find what I need?” “Is this worth the cost?”
- Emotions: Map these against the timeline to visualize the emotional curve.
Step 4: Identify Pain Points and Opportunities
Look for friction. Where does the user struggle? Is there a form that is too long? Is the loading time too slow? Is the language confusing? Once you find the pain, identify the opportunity. How can you fix it?
🧩 Key Components of a High-Quality Map
To make your map useful, it must include specific elements. These components provide the structure and depth needed for analysis.
1. The Persona
Place the persona at the top of the map. This reminds the team who they are designing for. Include their goals, motivations, and context.
2. The Stages
Clearly label the columns or sections with the journey phases. This provides the temporal structure of the narrative.
3. The User Actions
Describe what the user is doing in each stage. Be specific. Instead of “Browsing,” use “Filtering search results by price.”
4. The Touchpoints
Identify the specific channels used. This helps the team understand which departments own which parts of the experience.
5. The Emotional Line
Draw a curve representing the user’s emotional state. This visualizes the peaks and valleys of the experience. It highlights moments of delight and moments of despair.
6. Pain Points
Mark specific moments where the experience fails. Use a distinct color or icon to make these stand out. This directs attention to where resources should be allocated.
7. Opportunities
For every pain point, note a potential solution. This turns the map from a diagnostic tool into a planning tool.
🔄 As-Is vs. To-Be Scenarios
It is often useful to create two versions of the map. One represents the current reality, and the other represents the future vision.
| Feature | As-Is Map | To-Be Map |
|---|---|---|
| Purpose | Document current state and issues | Define desired future state |
| Data Source | Customer feedback and analytics | Strategic goals and research |
| Focus | Identifying friction and gaps | Highlighting improvements and delights |
| Usage | Diagnosis and problem-solving | Planning and prioritization |
| Emotional Curve | Reflects actual user frustration | Reflects potential user satisfaction |
Using both maps allows you to see the delta. It shows exactly how much work is needed to bridge the gap between the current experience and the ideal one.
⚠️ Common Pitfalls to Avoid
Even experienced designers make mistakes when creating journey maps. Be aware of these common traps to ensure your work is effective.
1. Relying on Assumptions
Do not guess what the user thinks. If you do not have data, say so. Assumptions lead to designs that solve the wrong problems. Validate every insight with user feedback.
2. Too Much Detail
A map that contains every single click is too granular. It becomes unreadable. Focus on the major milestones and emotional peaks. Keep the high-level view unless you are doing a deep-dive usability study.
3. Ignoring Internal Stakeholders
A journey map is not just for the design team. If the backend systems or support staff are not aligned, the front-end experience will fail. Ensure the map reflects the capabilities of the organization.
4. Creating a Static Document
A map is a living document. User behavior changes. Products evolve. If you create the map and never update it, it becomes obsolete. Schedule regular reviews to keep the information current.
5. Focusing Only on Digital Channels
Do not forget offline interactions. A customer might research online but buy in-store. Or they might call support after a digital failure. A complete map considers all channels.
🔍 Validating Your Work
Once the map is drafted, you must validate it. This ensures accuracy and buy-in. Validation is not a one-time step; it is part of the creation process.
- Review with Users: Show the map to actual users. Ask if it matches their experience. Do they recognize their feelings? Do they feel their journey is represented accurately?
- Review with Stakeholders: Present the map to leadership and other departments. Ask if the proposed solutions are feasible. Are the resources available?
- Test with Data: Cross-reference the map with analytics. If the map says users struggle at step 3, does the drop-off rate reflect that?
Validation builds trust. When the team sees that the map is grounded in reality, they are more likely to act on the insights it provides.
🚀 Keeping the Map Alive
The journey does not end when the map is finished. It is a tool for continuous improvement. To keep it relevant:
- Share Widely: Put the map on the wall or pin it in the digital workspace. It should be visible to everyone.
- Update Regularly: Schedule quarterly reviews. Add new data points as they become available.
- Link to Projects: Connect specific map pain points to actual design tickets or development tasks. This ensures the insights lead to action.
- Train the Team: Ensure new hires understand how to read and use the map. It is part of the organizational knowledge base.
📊 Measuring Success
How do you know the journey map was worth the effort? You measure it by the changes it drives. Look for improvements in key metrics.
- Customer Satisfaction (CSAT): Do users report higher satisfaction after changes are made?
- Net Promoter Score (NPS): Does the likelihood of recommendation increase?
- Task Success Rate: Do users complete tasks faster or with fewer errors?
- Support Tickets: Does the volume of complaints decrease?
These metrics provide the proof that the journey map is delivering value. They justify the time and resources invested in the mapping process.
🌟 Final Thoughts
Building a customer journey map is a skill that grows with practice. It requires patience, research, and empathy. It is not about making things look pretty; it is about understanding the human behind the screen. By following this guide, you are equipping yourself with a method to create better, more meaningful experiences. Remember to stay grounded in data, keep the user at the center, and treat the map as a living document that evolves with your product.
Start small. Pick one journey. Gather the data. Draw the map. Share it. Iterate. This cycle is the heart of good UX design. Good luck with your journey mapping endeavors.

