Creating a visual representation of how a client interacts with your brand is a significant step. However, a map without a compass leads nowhere. To truly understand the effectiveness of your customer journey, you must measure it. This process involves selecting the right Key Performance Indicators (KPIs) that align with the specific stages of the experience you have mapped out.
Many organizations stop at the diagram. They draw the touchpoints and assume the work is done. In reality, the value lies in the data collected along that path. By tracking specific metrics, you transform a static document into a living strategy. This guide details how to identify, implement, and utilize KPIs to validate your customer journey mapping efforts.
Why Measurement Matters in Journey Mapping 📉
A customer journey map is essentially a hypothesis. It represents what you think the customer experiences, feels, and does at every stage. Without measurement, this hypothesis remains unverified. You cannot know if a friction point identified in the map actually causes drop-offs unless you measure conversion rates at that specific touchpoint.
Implementing KPIs serves three primary functions:
- Validation: It confirms whether your assumptions about user behavior match reality.
- Optimization: It highlights where the journey breaks down, allowing for targeted improvements.
- Alignment: It ensures that different departments (sales, support, marketing) are tracking the same success metrics.
When you measure the journey, you move from guessing to knowing. This shift allows for resource allocation based on evidence rather than intuition.
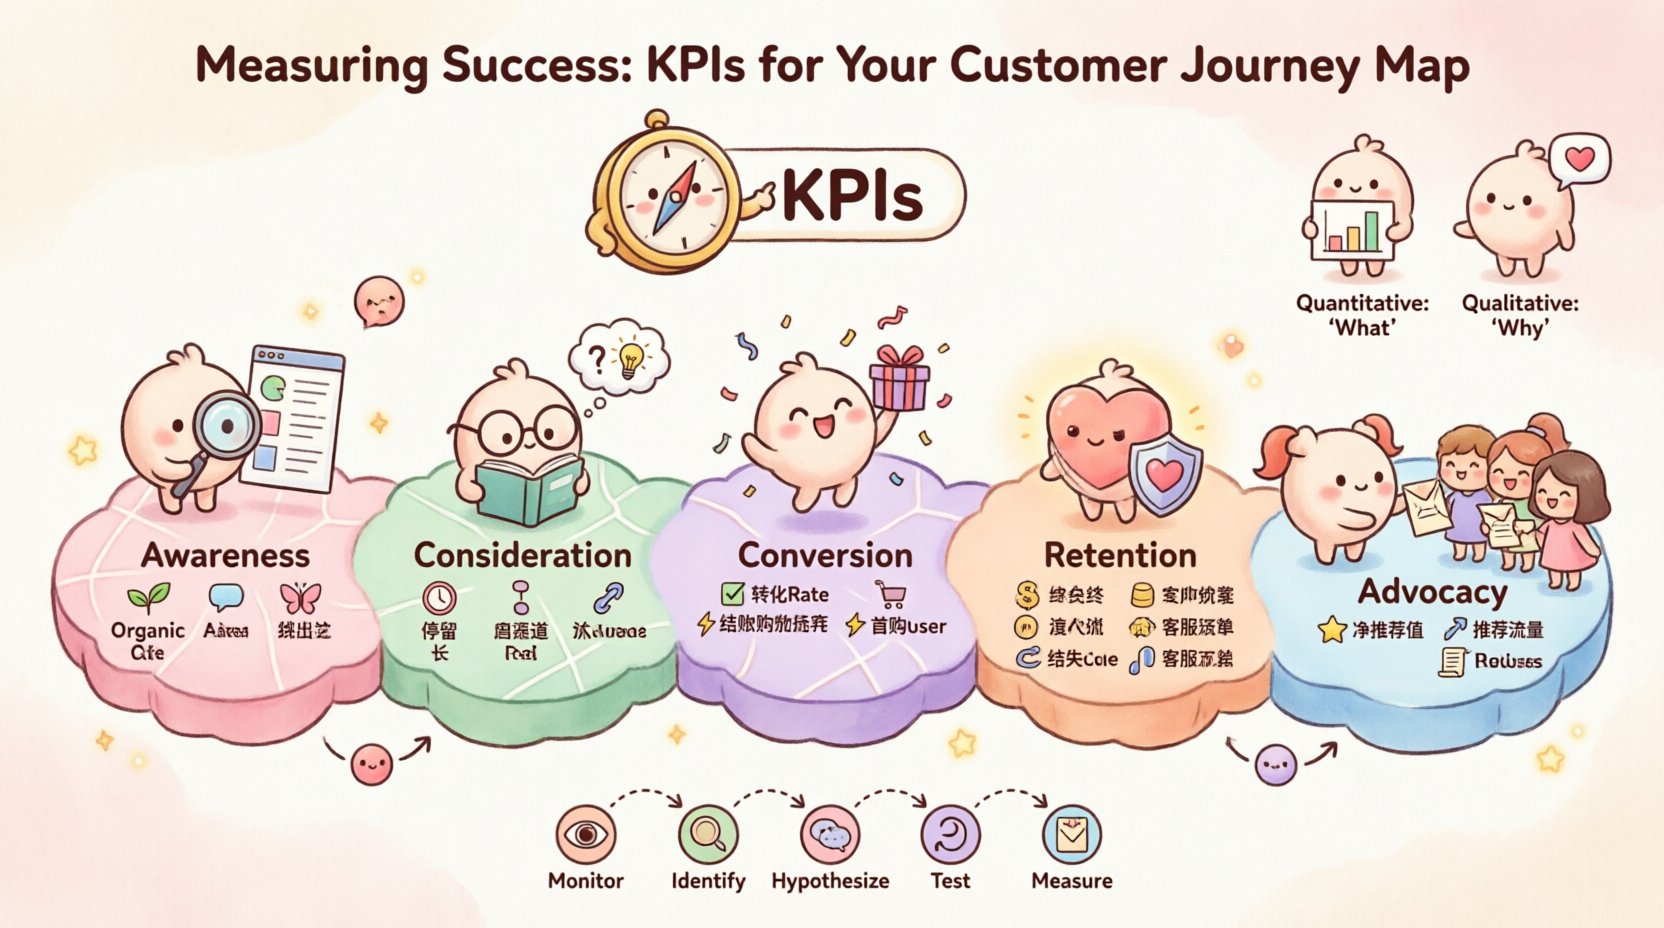
Understanding the Two Types of Metrics 🔍
To get a complete picture, you need to balance quantitative data with qualitative insights. Relying on one or the other creates blind spots. Quantitative metrics tell you what is happening, while qualitative data explains why it is happening.
Quantitative Metrics
These are numerical values derived from system logs, transaction records, and analytics platforms. They are objective and easy to track over time. Common examples include:
- Page views per session
- Cart abandonment rates
- Time spent on specific pages
- Number of support tickets opened
- Conversion rates per funnel stage
Qualitative Metrics
These metrics capture the human element of the experience. They are often subjective and require analysis of text or sentiment. These are crucial for understanding the emotional state of the customer.
- Customer Satisfaction Scores (CSAT)
- Net Promoter Score (NPS)
- Customer Effort Score (CES)
- Open-ended survey responses
- Sentiment analysis of social media mentions
Table 1 below summarizes how these two types of data interact at different stages of the journey.
| Stage | Quantitative Focus | Qualitative Focus |
|---|---|---|
| Awareness | Traffic sources, Click-through rates | Brand perception, Initial sentiment |
| Consideration | Time on site, Content downloads | Trust levels, Concerns raised |
| Conversion | Cart completion, Sign-up rate | Friction points, Decision confidence |
| Retention | Repeat purchase rate, Churn rate | Loyalty, Support satisfaction |
| Advocacy | Referral count, Social shares | Brand advocacy, Word of mouth |
Key Performance Indicators by Journey Stage 🛣️
Selecting the right KPI depends entirely on where the customer is in their lifecycle. A metric that matters at the top of the funnel may be irrelevant at the bottom. Here is a breakdown of essential indicators for each phase.
1. Awareness Stage
This stage involves the customer realizing they have a problem and discovering your brand as a potential solution. The goal here is reach and relevance.
- Organic Traffic Growth: Measures how many users find you without paid promotion. This indicates strong search engine optimization and content quality.
- Social Engagement Rate: Indicates how well your messaging resonates with the audience before they even visit your site.
- Bounce Rate: If users land on your site and leave immediately, your messaging might not match their intent.
2. Consideration Stage
Now the customer is evaluating options. They are comparing you against competitors. The goal is to provide clarity and build trust.
- Time on Page: Longer durations on comparison or product pages suggest deep interest.
- Content Consumption: Track how many resources (whitepapers, webinars) are downloaded.
- Multi-Channel Interaction: Count how many touchpoints a user engages with before converting. High interaction often correlates with higher intent.
3. Conversion Stage
This is the transaction point. The goal is efficiency and removing friction.
- Conversion Rate: The percentage of visitors who complete the desired action.
- Cart Abandonment Rate: Specifically for e-commerce, this highlights where the process stalls.
- Checkout Time: Faster is generally better, provided security is maintained.
- First-Time Buyer Rate: Measures the success of your acquisition efforts.
4. Retention Stage
Acquiring a customer is expensive; keeping them is profitable. This stage focuses on satisfaction and ongoing value.
- Customer Lifetime Value (CLV): The total revenue a business can expect from a single customer account.
- Churn Rate: The percentage of subscribers who stop using your service over a given period.
- Repeat Purchase Rate: Indicates product-market fit and satisfaction.
- Support Ticket Volume: A spike here often indicates a product issue or a confusing user experience.
5. Advocacy Stage
Happy customers become promoters. This stage is about leveraging that enthusiasm for growth.
- Net Promoter Score (NPS): A standard measure of loyalty and likelihood to recommend.
- Referral Traffic: How many new users come from existing customer links.
- Review Volume and Rating: The quantity and quality of public feedback.
Implementing Data Collection Strategies 📡
Identifying the metrics is only the first step. You must establish the mechanisms to capture them accurately. This requires a cohesive data strategy that connects disparate sources.
Unified Data Sources
Data often lives in silos. Marketing data might be in one system, while support data lives in another. To measure the journey effectively, you need to link these records.
- Unique Identifiers: Ensure you use consistent IDs (like email or user ID) across all platforms to track a single user’s path.
- Session Tracking: Use cookies or local storage to track anonymous sessions until a user identifies themselves.
- Integration: Connect your Customer Relationship Management (CRM) system with your analytics tools.
Avoiding Vanity Metrics
Not all numbers are created equal. Vanity metrics look impressive but do not inform decision-making.
- Page Views: High views mean nothing if no one converts.
- Followers: Social media followers do not guarantee engagement or sales.
- Downloads: Downloading a resource is a good sign, but reading it is better.
Focus on metrics that directly correlate with business outcomes. For example, instead of tracking total page views, track depth of scroll on landing pages to see if users actually read the content.
Qualitative Insights: Listening to the Voice of the Customer 👂
Numbers tell a story, but they often lack the emotional context. To understand the why behind the data, you must incorporate qualitative research into your KPI framework.
Net Promoter Score (NPS)
While NPS is a number, the follow-up question “Why did you give that score?” provides the qualitative depth. This feedback loop helps identify specific pain points that analytics might miss. For instance, analytics might show a drop-off at the payment page. NPS feedback might reveal that users are hesitant because they don’t see a specific payment method.
Customer Effort Score (CES)
Customer Effort Score measures how easy it was for a customer to resolve an issue or complete a task. This is particularly relevant for support interactions. A high effort score indicates a broken part of the journey. The formula is simple: ask the user to rate the ease of their experience on a scale.
User Testing and Feedback Loops
Regular usability testing provides real-time data on how people interact with your interface. You can record sessions to see where users hesitate or click incorrectly. This data supplements your KPIs by providing visual proof of the journey friction.
Attribution Models and Journey Complexity 🧩
Attribution is the method used to assign credit to the touchpoints that led to a conversion. In a complex customer journey, a single conversion rarely happens from one click. Understanding which model to use impacts which KPIs you prioritize.
- Last Click Attribution: Gives all credit to the final interaction before conversion. This is simple but ignores the nurturing that happened earlier.
- First Click Attribution: Gives all credit to the first interaction. This highlights top-of-funnel performance but ignores closing tactics.
- Linear Attribution: Distributes credit equally across all touchpoints. This acknowledges the holistic nature of the journey.
- Time Decay: Gives more credit to interactions that occurred closer to the conversion.
For journey mapping, a multi-touch or linear approach is often more accurate. It prevents the marketing team from ignoring early-stage content because the sales team claims credit for the final sale.
Common Pitfalls in Journey Measurement ⚠️
Even with the right metrics, errors can occur during implementation. Being aware of common mistakes helps you maintain data integrity.
1. Ignoring the Offline Journey
If you sell physical products, interactions often happen in-store or over the phone. Digital analytics will not capture these. You must find ways to track offline conversions, perhaps through unique promo codes or post-purchase surveys asking how they heard about the brand.
2. Over-Segmentation
Breaking data down too finely can obscure trends. If you segment by too many variables (location, device, time, referral source), you may end up with data sets that are too small to be statistically significant. Start broad and drill down only when you see anomalies.
3. Focusing Only on the Happy Path
It is easy to track the ideal journey from landing page to purchase. However, the most valuable insights often come from the non-linear paths. Users often skip steps, go back, or get lost. Measure the actual journey, not just the intended one.
4. Data Privacy Compliance
Collecting journey data requires adherence to regulations like GDPR or CCPA. Ensure your tracking methods respect user consent. If a user opts out of cookies, you cannot track their journey across the web. This impacts the completeness of your data.
Iterating Based on Data 🔄
A customer journey map is not a one-time document. It is a living asset that evolves as your business and customers change. The measurement phase feeds directly into the iteration phase.
- Monitor: Set up dashboards to track your selected KPIs in real-time.
- Identify: Look for trends, drops, or spikes in the data.
- Hypothesize: Form a theory about why the change occurred based on your journey map.
- Test: Implement a change to address the issue (e.g., simplifying a form, changing copy).
- Measure: Observe the impact on the KPIs after the change.
This cycle ensures continuous improvement. If a metric improves, the hypothesis is validated. If it does not, you learn something new about your customer’s behavior.
Building a Culture of Measurement 🏗️
Finally, technical implementation is only half the battle. You need a culture that values data-driven decision-making. This means training teams to look at the KPIs relevant to their roles.
- Marketing Teams: Focus on conversion rates and acquisition costs.
- Product Teams: Focus on feature adoption and usage frequency.
- Support Teams: Focus on resolution time and satisfaction scores.
- Executive Leadership: Focus on CLV and churn rates.
When everyone understands how their work impacts the overall customer journey, alignment improves. Silos break down because the shared metric is the customer experience itself.
Final Thoughts on Journey Analytics 🧭
Measuring the customer journey is a complex endeavor that requires discipline and patience. There is no single metric that tells the whole story. Success comes from weaving together quantitative data with qualitative insights.
By focusing on the right KPIs for each stage of the map, you gain clarity on where your strategy is working and where it is failing. This clarity allows for precise adjustments that improve the experience for the customer and the bottom line for the business.
Remember that data is a tool for understanding, not a judge of performance. Use it to empathize with your users and solve their problems. When you prioritize the customer experience through rigorous measurement, you build a foundation for sustainable growth.

