Understanding the customer experience requires more than just looking at sales numbers. It demands a deep dive into the steps a person takes before, during, and after interacting with a brand. Customer Journey Maps (CJM) serve as the visual blueprint for this exploration. By plotting every touchpoint and interaction, organizations can pinpoint exactly where friction occurs. Identifying these pain points is not about guessing; it is about systematic analysis of user behavior and sentiment.
This guide outlines the methodology for uncovering friction within a customer journey. It focuses on practical strategies to map the current state, analyze data, and categorize obstacles. The goal is to provide a clear path toward improving satisfaction and operational efficiency without relying on external tools or hype.
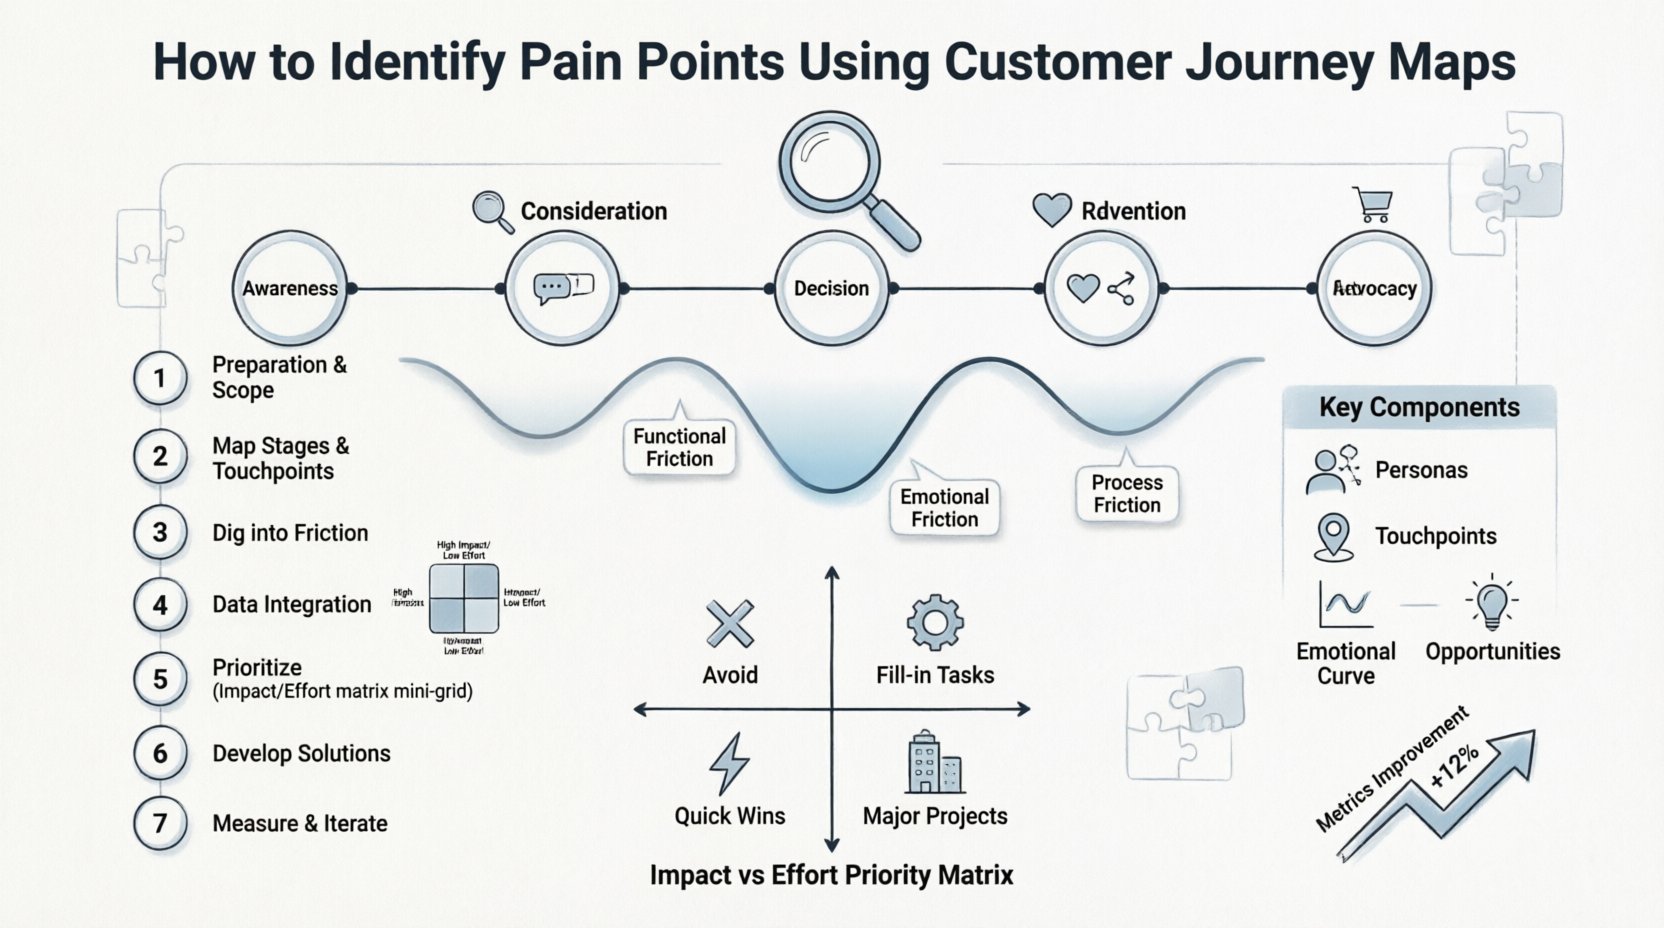
🔍 The Foundation of Customer Journey Mapping
A Customer Journey Map is a diagram that represents the process a customer goes through to accomplish a specific goal. It is not merely a timeline; it is a composite of actions, thoughts, and feelings. When used correctly, it highlights the gap between what the business expects and what the customer actually experiences.
Key Components of a Map
- Personas: Representations of specific user groups. Different personas face different challenges.
- Stages: The broad phases of the relationship (e.g., Awareness, Consideration, Purchase).
- Touchpoints: Specific interactions where the customer engages with the brand (website, call center, product).
- Emotional Curve: A visual representation of how the customer feels at each stage.
- Opportunities: Areas identified where the experience can be improved.
To identify pain points effectively, one must first understand that friction exists in three primary dimensions: functional, emotional, and process-related. A functional pain point might be a broken link. An emotional one could be confusion or anxiety. A process pain point often involves unnecessary steps or waiting times.
🚧 Why Identifying Pain Points Matters
Ignoring friction leads to churn. When a customer encounters a hurdle they cannot overcome, they often abandon the process. This is not just a loss of a single transaction; it impacts long-term loyalty and brand reputation. Identifying these points allows for targeted interventions.
Benefits of mapping pain points include:
- Improved Retention: Fixing friction keeps customers longer.
- Higher Conversion Rates: Removing obstacles during the purchase phase increases completion.
- Resource Allocation: Teams know exactly where to focus time and budget.
- Employee Alignment: All departments see the same customer reality.
📋 Phase 1: Preparation and Scope Definition
Before drawing lines on a board, preparation is essential. A journey map that tries to cover every possible customer is often too vague to be useful. Specificity drives insight.
Define the Scope
Decide which journey you are mapping. Is it the journey to purchase a new subscription? Is it the onboarding process? Is it the support experience? Narrowing the scope ensures depth over breadth.
Select the Persona
Not all customers are the same. A beginner user will have different pain points than an expert user. Choose a primary persona to anchor the map. If resources allow, create secondary maps for other segments.
Gather Initial Data
Do not rely solely on internal assumptions. Start with existing data points:
- Analytics: Look for drop-off rates in digital funnels.
- Support Tickets: Review common complaints and recurring issues.
- Surveys: Check Net Promoter Score (NPS) or Customer Satisfaction (CSAT) feedback.
- Interviews: Conduct qualitative interviews with recent users.
🗺️ Phase 2: Mapping the Stages and Touchpoints
Once the scope is set, visualize the journey. Break the experience down into logical stages. For a standard transactional journey, the stages typically follow this flow:
- Awareness: The customer realizes they have a need.
- Consideration: They research options and compare solutions.
- Decision: They choose a provider and initiate the transaction.
- Retention: They use the product or service.
- Advocacy: They recommend the brand to others.
For each stage, list the specific touchpoints. If the stage is “Decision,” the touchpoint might be a pricing page, a sales call, or a contract review. This granularity is where pain points often hide.
Common Pain Points by Stage
Below is a breakdown of typical friction points encountered across different stages of a journey.
| Stage | Common Pain Point | Impact | Indicator |
|---|---|---|---|
| Awareness | Confusing messaging or unclear value proposition | Low engagement | High bounce rate on landing pages |
| Consideration | Difficulty comparing features or pricing | Extended decision time | Multiple page visits without conversion |
| Decision | Complex checkout or payment errors | Cart abandonment | High drop-off at payment gateway |
| Retention | Complicated onboarding or lack of guidance | Low activation | Low usage of core features |
| Advocacy | Unclear referral process or reward structure | Low word-of-mouth | Low referral sign-ups |
🔎 Phase 3: Digging Deeper into Friction
A map shows the “what” and the “where.” To understand the “why,” you must analyze the emotional and behavioral data associated with each touchpoint. This phase is about connecting the dots between user actions and their underlying feelings.
Emotional Mapping
Ask the customer how they felt at each step. Plot these feelings on a curve. A dip in the emotional curve indicates a pain point. For example, if a user feels confident during research but anxious during payment, the payment process is a friction point.
Behavioral Analysis
Observe what users actually do versus what they say they do. Analytics often reveal hidden behaviors. If users hover over a button but never click, the button might be unclear or the value proposition insufficient. If users navigate back and forth between two pages, they are likely confused by the flow.
Types of Friction to Investigate
When reviewing the map, look for these specific types of friction:
- Navigation Friction: Users cannot find what they need easily.
- Information Friction: Too much information causes paralysis, or too little causes uncertainty.
- Process Friction: Too many steps, forms, or approvals are required.
- Technical Friction: Slow load times, bugs, or incompatibility.
- Communication Friction: Inconsistent messaging across channels.
📊 Phase 4: Data Integration and Validation
Qualitative insights tell a story, but quantitative data validates it. To ensure the pain points identified are accurate, cross-reference your map with hard metrics.
Qualitative Data Sources
- One-on-one user interviews.
- Focus groups.
- Usability testing sessions.
- Customer support transcripts.
Quantitative Data Sources
- Conversion rate optimization data.
- Session recording heatmaps.
- Exit page analytics.
- Customer lifetime value (CLV) trends.
When qualitative and quantitative data align, the pain point is confirmed. If they diverge, further investigation is needed. For instance, users might say a form is easy, but analytics show they are abandoning it. In this case, the form likely has a hidden complexity that users are too polite to mention in interviews.
📉 Phase 5: Prioritizing the Pain Points
You will likely find dozens of pain points. You cannot fix them all at once. Prioritization ensures that efforts yield the highest return. Use a matrix to evaluate each point based on two criteria: Impact and Effort.
The Impact vs. Effort Matrix
Plot each identified pain point on a grid.
- High Impact, Low Effort: Quick wins. Fix these first.
- High Impact, High Effort: Major projects. Plan these strategically.
- Low Impact, Low Effort: Fill-in tasks. Do these when time permits.
- Low Impact, High Effort: Avoid or deprioritize.
Consider Severity and Frequency
Not all friction is equal. A pain point that affects 1% of users might be a niche issue, while one affecting 50% is systemic. Similarly, a pain point that causes immediate churn is more severe than one that causes minor annoyance. Weight your prioritization matrix accordingly.
🛠️ Phase 6: Developing Solutions
Once the high-priority pain points are identified, move to solution design. This step requires cross-functional collaboration. The person who builds the feature is not always the person who knows the customer pain.
Co-Creation Workshops
Bring together stakeholders from sales, support, product, and marketing. Review the map together. Ask: “What would make this step easier for the customer?” Brainstorm solutions that address the root cause, not just the symptom.
Prototype and Test
Before full implementation, test the proposed solution. Create a prototype or a simplified version. Run a small usability test to see if the friction is actually reduced. This prevents wasting resources on fixes that do not work.
Implementation Checklist
- Does the solution address the specific pain point identified?
- Does it align with the brand voice and values?
- Is it accessible to all users?
- Have we trained the support team on this change?
- Is there a plan to measure success?
📈 Phase 7: Measuring Impact and Iterating
Improving the journey is not a one-time event. It is a continuous cycle. After implementing changes, you must measure the results against the baseline established in the preparation phase.
Key Metrics to Track
- Conversion Rate: Did the drop-off decrease?
- Task Completion Time: Is the process faster?
- Customer Satisfaction Score: Did sentiment improve?
- Support Ticket Volume: Did inquiries related to this area drop?
Regular Updates
The customer journey changes over time. New features are added, competitors enter the market, and customer expectations shift. Schedule regular reviews of the journey map. Update it at least quarterly or whenever a significant business change occurs.
🧠 Understanding the Psychology of Friction
To truly master the art of identification, one must understand the psychology behind why friction frustrates users. Humans are wired for efficiency. When a path is smooth, we feel in control. When we hit a wall, we feel a loss of autonomy.
Decision Fatigue: Too many choices at the Consideration stage can lead to paralysis. Users may not choose a competitor; they may simply stop looking.
Trust Deficits: If a payment page looks unsecured, anxiety spikes. Trust is a currency that must be earned at every touchpoint.
Context Switching: Moving from a mobile app to a desktop site without saving progress causes frustration. Consistency across devices is crucial for maintaining flow.
🤝 Cross-Departmental Alignment
Pain points often exist in the silos between departments. Marketing promises one thing, while Support delivers another. The journey map acts as a single source of truth.
Share the map with all teams. When Support sees the “Decision” stage pain points, they can prepare scripts to address common objections. When Product sees the “Retention” friction, they can prioritize onboarding features. Alignment reduces internal friction, which translates to external friction reduction.
🔒 Final Considerations
Identifying pain points through customer journey mapping is a rigorous process that requires patience and empathy. It involves digging beneath surface-level metrics to understand the human experience. By systematically mapping stages, gathering diverse data, and prioritizing based on impact, organizations can create smoother, more satisfying experiences.
Remember that the map is a living document. It evolves as the customer does. The goal is not perfection, but continuous improvement. Every friction point removed is a step toward a more loyal and engaged customer base. Start with the data you have, validate with the people you serve, and iterate based on what you learn.
Success in customer experience is not about grand gestures. It is about removing the small obstacles that stand between a customer and their goal. Use the journey map as your compass to navigate this path.
