Understanding how customers interact with your brand is critical for sustainable growth. A customer journey map provides a visual representation of every interaction a client has with your business. It goes beyond simple analytics to show the emotional and psychological state of the user at each stage. By visualizing this path, organizations can identify friction points, streamline processes, and enhance overall satisfaction.
This guide outlines the process of creating a comprehensive map. We will explore the mechanics of mapping, the importance of empathy, and the steps required to build a tool that drives real value. No software is required to begin; the focus is on strategy, insight, and human understanding.
Why Customer Journey Mapping Matters 🧠
Before diving into the execution, it is vital to understand the strategic value. Many businesses operate in silos, where marketing, sales, and support teams do not share a unified view of the customer. This fragmentation leads to inconsistent experiences.
- Alignment: It ensures all departments understand the customer perspective.
- Identification of Gaps: You can see where the experience breaks down before it becomes a churn risk.
- Data-Driven Decisions: It moves decision-making from intuition to evidence.
- Empathy: It forces teams to step out of their internal roles and view the product through the user’s eyes.
A well-executed map is not a one-time project. It is a living document that evolves as your business and customer expectations change.
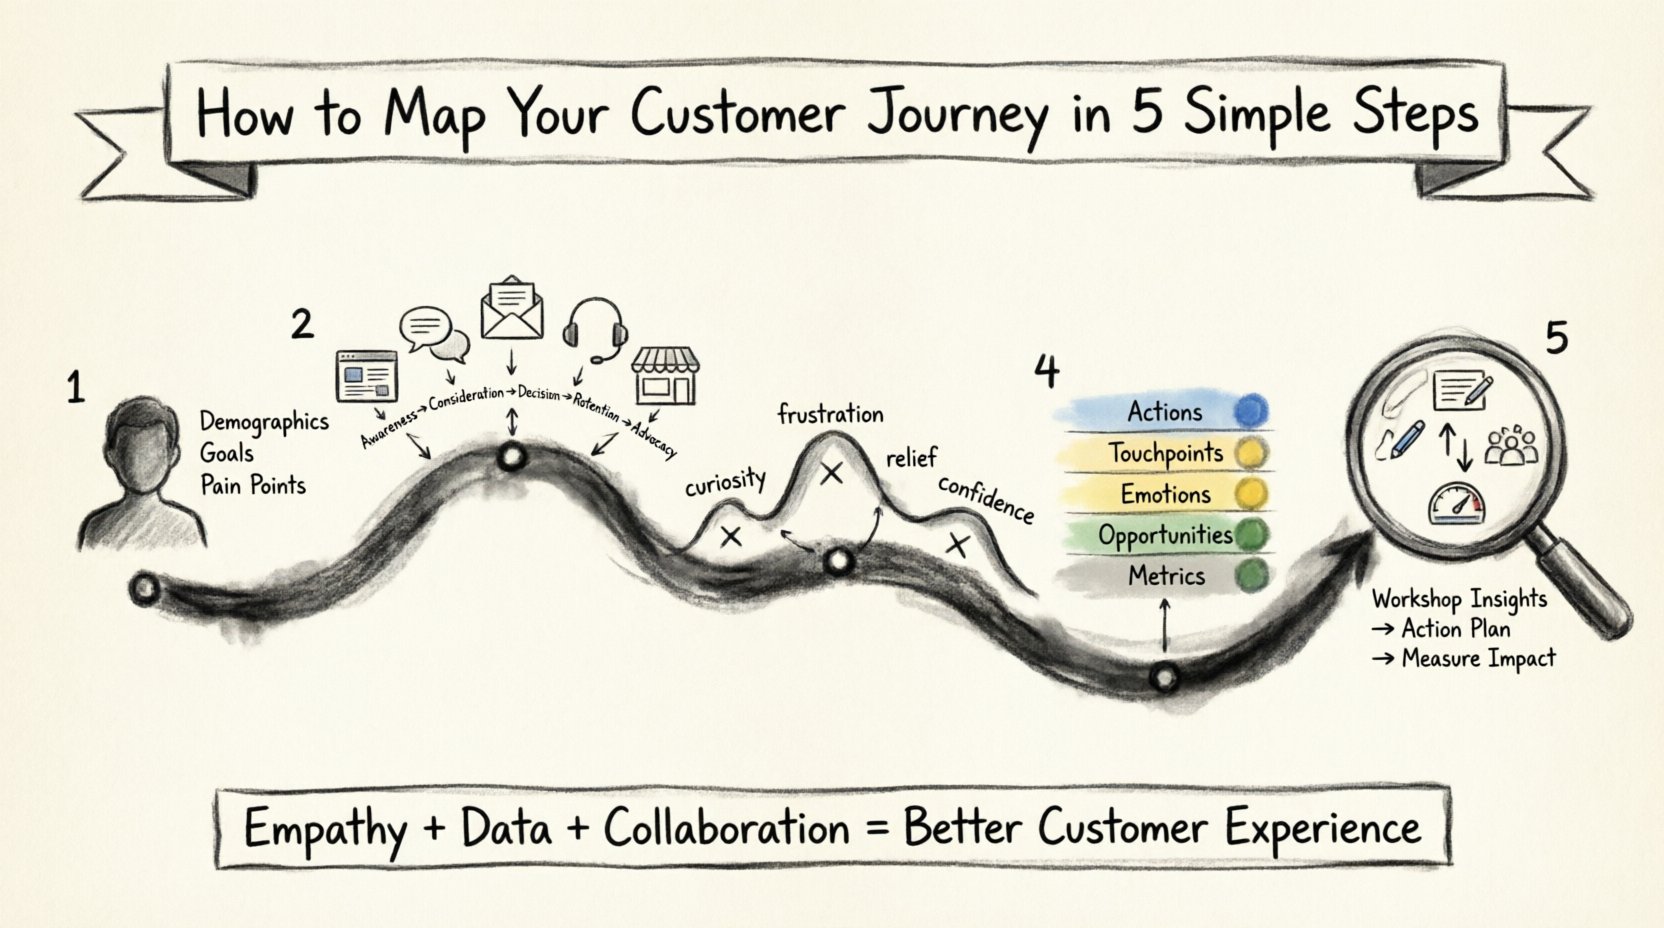
Step 1: Define Your Buyer Personas 👤
You cannot map a journey without knowing who is traveling it. A single map often fails to capture the nuances of different customer segments. Different personas have different goals, motivations, and pain points. Start by segmenting your audience.
Creating the Persona Profile
Gather existing data to build detailed profiles. Do not rely on assumptions. Use data from interviews, support tickets, and sales records.
- Demographics: Age, location, job title, income level.
- Goals: What are they trying to achieve with your product or service?
- Pain Points: What obstacles currently stop them from success?
- Behaviors: How do they typically research or buy? Do they prefer mobile or desktop?
For example, a B2B company might have a persona for a “Decision Maker” focused on ROI and security, and another for an “End User” focused on ease of use and training time. These two personas may travel the same product journey but with vastly different emotional landscapes.
Assigning a Narrative
Give each persona a name and a backstory. This humanizes the data. When your team reviews the map, they should ask, “Would Sarah (the persona) be frustrated here?” rather than “Is this step efficient?” This shift in language is crucial for empathy.
Step 2: Identify All Touchpoints 📍
A touchpoint is any instance where a customer interacts with your brand. These interactions can happen before, during, and after the purchase. Mapping these points creates the backbone of your journey.
Phases of Interaction
Divide the journey into logical stages. The standard framework includes:
- Awareness: The customer realizes they have a problem or need.
- Consideration: They research solutions and compare options.
- Decision: They choose a vendor and make a purchase.
- Retention: They use the product and interact with support.
- Advocacy: They recommend the brand to others.
Mapping the Channels
For each stage, list every channel where interaction occurs. This helps visualize the complexity of the experience.
- Website: Landing pages, blog posts, pricing pages.
- Social Media: Ads, organic posts, comments, direct messages.
- Email: Newsletters, transactional emails, abandoned cart sequences.
- Customer Support: Live chat, phone calls, ticketing systems.
- Physical: In-store visits, packaging, printed materials.
Ensure you capture both positive and negative touchpoints. Sometimes the most critical interactions happen during a crisis, such as a billing error or a product failure. These moments define loyalty more than a smooth purchase.
Step 3: Uncover Emotions and Pain Points 💔
Numbers tell you what is happening; emotions tell you why it matters. At every touchpoint identified in the previous step, you must assess the emotional state of the customer. This is often the most overlooked aspect of journey mapping.
Emotional Curves
Visualize the emotional highs and lows. A customer might feel excitement when discovering a new feature but anxiety when navigating a complex checkout process.
- Curiosity: Early stages often involve research and learning.
- Frustration: Common when processes are unclear or broken.
- Relief: Occurs when a problem is solved or a need is met.
- Confidence: Builds trust in the brand.
- Confusion: A major barrier that leads to drop-offs.
Identifying Friction
Friction is anything that slows down progress or increases effort. It is not just about technical errors; it is about cognitive load.
- Time Friction: Waiting on hold or loading times.
- Process Friction: Too many forms to fill out.
- Communication Friction: Confusing language or lack of clarity.
- Access Friction: Difficulty finding information.
For each stage, document the primary emotion and the top friction point. This highlights where the experience needs immediate attention. If a customer feels anxious during the checkout phase, the design or copy likely lacks reassurance.
Step 4: Visualize the Map 🎨
Once you have the data, personas, and touchpoints, it is time to assemble the visual artifact. The goal is to create a document that is easy to understand and share across the organization.
Choosing the Layout
There is no single correct format, but the most effective maps are horizontal. This mimics the flow of time. The stages of the journey run from left to right, and the touchpoints are placed along the timeline.
- Rows: Different rows can represent different personas or different channels.
- Columns: Each column represents a stage of the journey.
- Annotations: Use notes to explain specific insights or data points.
Key Components to Include
A robust map includes several layers of information stacked vertically.
| Layer | Description |
|---|---|
| Actions | What the customer is actually doing at this step. |
| Touchpoints | Where the action takes place (channel). |
| Emotions | How the customer feels (positive, neutral, negative). |
| Opportunities | Areas where improvement is possible. |
| Metrics | How to measure success at this stage. |
Keep the design clean. Avoid clutter. If the map is too complex, stakeholders will not engage with it. Use color coding to indicate sentiment (e.g., green for positive, red for negative) to allow for instant recognition of problem areas.
Step 5: Analyze and Optimize 🔍
Creating the map is only the beginning. The true value lies in acting on the insights. This step involves reviewing the map with stakeholders and implementing changes.
Internal Workshops
Conduct workshops where teams review the map together. Ask questions like:
- Where are we currently failing the customer?
- Which touchpoints are under-resourced?
- Do our internal processes support the customer needs shown here?
This collaborative approach breaks down silos. When support sees the marketing map, they understand why certain promises were made. When marketing sees the support map, they understand the reality of post-sale issues.
Implementing Changes
Prioritize fixes based on impact and effort. Focus on high-impact, low-effort improvements first to build momentum. Examples include:
- Clarifying copy on a landing page to reduce confusion.
- Reducing the number of fields in a sign-up form.
- Adding a chat widget to a pricing page for instant questions.
- Creating a dedicated onboarding email sequence for new users.
Continuous Monitoring
Customer behavior changes. Market conditions shift. Your map must reflect the current reality. Schedule regular reviews, such as quarterly or bi-annually, to update the journey.
- Track new feedback from surveys.
- Monitor changes in customer support trends.
- Review analytics data for shifts in conversion rates.
Common Mistakes to Avoid 🚫
Even experienced teams can stumble when mapping journeys. Being aware of common pitfalls helps you build a more accurate tool.
- Assuming One Size Fits All: Treating all customers the same ignores critical segmentation. Always create maps for different personas.
- Ignoring the Post-Purchase Phase: The journey does not end at the sale. Retention and advocacy are where long-term value is generated.
- Relying Solely on Internal Views: Do not map how you think the customer behaves. Map how they actually behave based on data and feedback.
- Creating a Static Document: A map that sits in a folder is useless. It must be a living resource used in meetings and strategy sessions.
- Focusing Only on Digital: If you have a physical presence, ignore the in-store experience at your peril. Omnichannel is the standard.
Measuring Success: Key Metrics 📊
How do you know if your mapping and subsequent optimization efforts are working? You need to tie journey improvements to tangible business metrics.
- Customer Satisfaction Score (CSAT): Measures immediate satisfaction after a specific interaction.
- Net Promoter Score (NPS): Gauges loyalty and the likelihood of recommendation.
- Customer Effort Score (CES): Specifically measures how easy it was for the customer to accomplish their goal.
- Churn Rate: Indicates if friction in the journey is causing users to leave.
- Conversion Rate: Tracks the percentage of users moving from one stage to the next.
- Customer Lifetime Value (CLV): The long-term value of a customer relationship.
Tracking Friction Reduction
When you fix a pain point, look for specific improvements in these metrics. If you simplify a checkout process, you should see a drop in cart abandonment and an increase in conversion. If you improve onboarding, you should see higher activation rates.
Frequently Asked Questions ❓
How often should I update my customer journey map?
While there is no fixed rule, a quarterly review is recommended. Significant changes in the business, such as new product launches or major rebranding, also warrant an immediate update.
Can small businesses benefit from this?
Absolutely. Small businesses often have more intimate relationships with customers, making it easier to gather qualitative data. Mapping helps them scale their understanding without losing the personal touch.
Do I need special tools to create a map?
No. You can use whiteboards, sticky notes, or standard presentation software. The value comes from the insights, not the medium used to draw it.
What if the data is conflicting?
Conflicting data is common. It usually indicates a segment issue or a gap in data collection. Revisit your personas and ensure you are gathering data from the same source for consistency. Qualitative interviews can often resolve quantitative discrepancies.
How do I get buy-in from stakeholders?
Focus on the business impact. Show how improving the journey reduces costs (e.g., fewer support tickets) and increases revenue (e.g., higher conversion). Use the map to tell a story that aligns with company goals.
Final Thoughts on Journey Mapping 🏁
Building a customer journey map is a disciplined process that requires empathy, data, and cross-functional collaboration. It is not a marketing gimmick but a strategic asset. By following these five steps, you create a shared understanding of your customer’s reality.
The journey never truly ends. As you optimize, you will discover new layers of complexity. Stay curious, listen to your customers, and keep the map updated. This commitment to understanding is what separates good experiences from great ones.
Start today. Gather your team, pull up your data, and begin the process of seeing your business through their eyes. The path to better customer experience is paved with these maps.

