Understanding how your customers interact with your brand is essential for sustainable growth. A customer journey map visualizes this process, showing every step a user takes from initial awareness to post-purchase support. However, creating an effective map requires precision, empathy, and rigorous data analysis. Many organizations attempt this process without a clear strategy, resulting in static diagrams that offer little actionable insight. To ensure your mapping efforts yield real value, you must adhere to specific best practices while avoiding common structural errors. This guide outlines the critical do’s and don’ts for building a functional customer journey map that drives tangible business results.
What is a Customer Journey Map? 🤔
A customer journey map is a diagram that illustrates the steps a customer takes while engaging with a company or brand. It is not merely a sales funnel. Instead, it focuses on the emotional and experiential aspects of the relationship. This visual representation includes every touchpoint where a customer interacts with your business, whether that is a website visit, a phone call, or a physical store interaction. By mapping these interactions, teams can identify friction points, opportunities for improvement, and moments of delight.
The primary goal is to shift the perspective from internal capabilities to external experiences. It answers questions like: How does the customer feel when they encounter this page? What information are they missing at this stage? Why do they drop off at this specific checkout step? Without this clarity, marketing and support teams often work in silos, creating disjointed experiences that confuse the user.
Why You Need One (Benefits) 💡
Implementing customer journey mapping is not just an exercise in documentation. It is a strategic tool that aligns teams and prioritizes customer needs. Here are the core benefits of investing time in this process:
- Unified Understanding: Different departments often have conflicting views of the customer. Sales might view a lead as a number, while support sees a frustrated individual. A map harmonizes these perspectives.
- Identification of Gaps: You can spot where the experience breaks down. Perhaps a promise made on social media is not honored in the email follow-up.
- Data-Driven Decisions: Instead of guessing what users want, the map relies on research and behavioral data to guide product development and service improvements.
- Resource Allocation: You can direct budget and effort toward the touchpoints that matter most to retention and conversion.
The Core Components of a Journey Map 🧩
Before diving into the do’s and don’ts, it is vital to understand the anatomy of a robust map. A complete journey map typically includes the following elements:
- Persona: A specific archetype representing a segment of your user base. One map for all users is rarely effective because a new user and a power user have different needs.
- Stages: The chronological phases of the journey, such as Awareness, Consideration, Purchase, Retention, and Advocacy.
- Touchpoints: Every specific interaction point, including websites, mobile apps, ads, support tickets, and packaging.
- User Actions: What the customer is actually doing at each step.
- Emotional Curve: A line or graph indicating the user’s satisfaction or frustration level at each stage.
- Opportunities: Areas where the business can intervene to improve the experience.
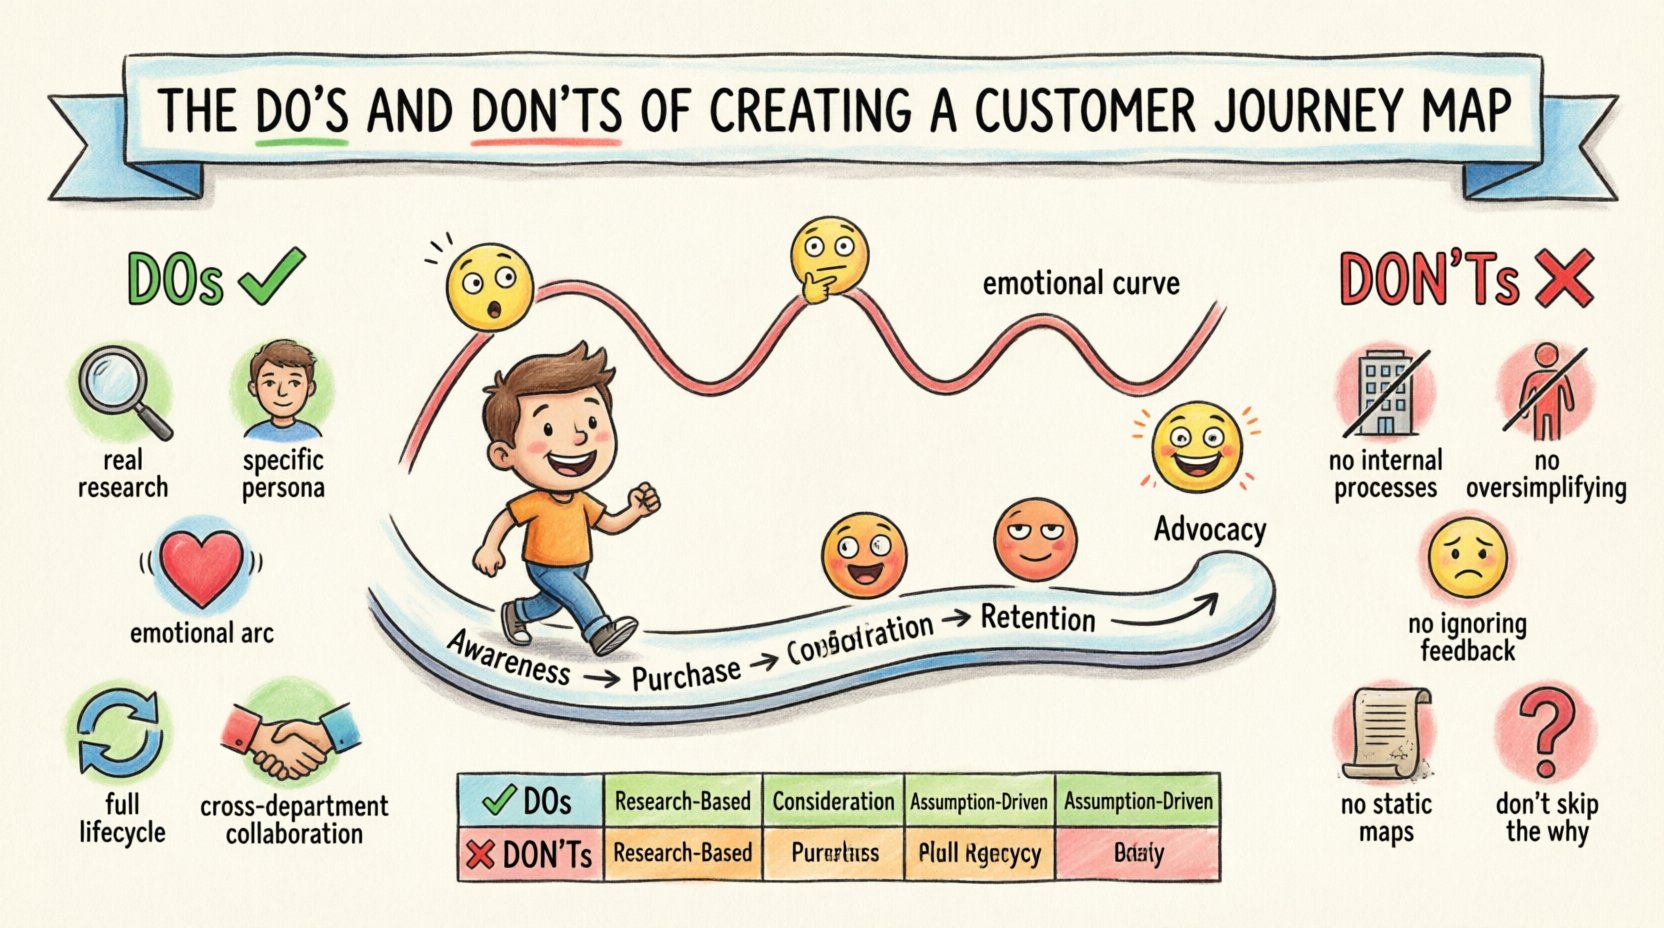
The Do’s: Best Practices for Accuracy and Impact ✅
To create a map that truly reflects reality, you must follow established methodologies. These practices ensure your map is accurate, actionable, and useful for stakeholders.
1. Base Your Map on Real Research 🔍
Never create a journey map based on assumptions or internal opinions. This is the most common failure point. Teams often project their own workflow onto the customer, assuming the user behaves exactly as the employee expects. Instead, gather data from multiple sources:
- Customer Interviews: Talk to actual users about their recent experiences.
- Analytics: Use quantitative data to understand drop-off rates and navigation paths.
- Support Logs: Review tickets and call transcripts to find recurring pain points.
- Surveys: Collect feedback at various stages of the funnel.
When you ground your map in verified data, it becomes a tool for validation rather than a document for debate. This approach builds trust among team members who might otherwise question the validity of the proposed journey.
2. Define a Specific Persona 🎭
A journey map should focus on a single persona or a very tightly defined group. Trying to map the journey for “everyone” dilutes the insights. A teenager buying their first smartphone has a completely different experience than an enterprise IT manager purchasing a server cluster. By narrowing your focus:
- You can tailor the language and tone to match the persona.
- You can identify specific motivations and barriers unique to that group.
- You can create more targeted solutions for their specific problems.
It is acceptable to create multiple maps for different personas, but do not try to force a single linear path to cover all users.
3. Include the Emotional Arc ❤️
Functional steps are important, but the emotional state of the customer is often the deciding factor in conversion or churn. Include a visual representation of how the user feels at each stage. Are they anxious during the payment process? Excited when receiving the product? Confused when setting up the account?
Mapping the emotional curve helps teams empathize with the user. It highlights moments of high stress that require immediate attention and moments of delight that should be replicated elsewhere. This humanizes the data and makes the map more compelling to leadership.
4. Map the Full Lifecycle, Not Just the Sale 🔄
Many organizations focus solely on the acquisition phase. However, the most valuable interactions often occur after the purchase. Include stages for onboarding, usage, renewal, and advocacy. A customer who is confused during onboarding will likely churn, regardless of how well they were sold the product. Ensuring the map covers the entire lifecycle reveals opportunities for retention and lifetime value expansion.
5. Collaborate Across Departments 🤝
Journey mapping is not a marketing task. It requires input from product, sales, support, engineering, and design. Different teams own different touchpoints. If marketing creates the map in isolation, they will miss technical constraints or support bottlenecks. Involve cross-functional teams in workshops to validate the flow and ensure everyone agrees on the current reality versus the desired future state.
The Don’ts: Common Pitfalls to Avoid ❌
Even with good intentions, journey mapping projects can go astray. Avoid these common mistakes to prevent your map from becoming a shelf-ware document.
1. Do Not Use Internal Process Flows 🚫
A customer journey map is not an internal workflow diagram. Do not list tasks that employees perform, such as “Manager approves ticket” or “IT configures server.” The focus must remain on the customer’s actions and perceptions. If you map internal processes, you lose the external perspective and fail to identify where the customer actually feels friction.
2. Avoid Over-Simplifying the Journey 🛑
Real customer journeys are rarely linear. Users jump between channels, revisit steps, and abandon carts multiple times. Do not force the journey into a neat, straight line. Acknowledge loops, backtracks, and parallel paths. If your map looks like a perfect staircase, it is likely inaccurate. Representing the complexity of the real experience allows you to design for flexibility.
3. Do Not Ignore Negative Feedback 😞
It is tempting to highlight only the positive aspects of the experience. However, the most valuable insights often come from failure. Do not sanitize the data to make the brand look good. If users are frustrated at a specific step, highlight it prominently. Ignoring negative feedback leads to missed opportunities for critical fixes.
4. Avoid Creating a Static Document 📄
A customer journey is dynamic. Products change, markets shift, and customer expectations evolve. If you create a map and file it away, it becomes obsolete quickly. Treat the map as a living document. Schedule regular reviews to update the content based on new data and feedback. A static map gives a false sense of security.
5. Do Not Skip the “Why” 🤷♂️
Don’t just list what happens; explain why it happens. Include the underlying motivations. For example, a user might abandon a cart not because the price is too high, but because they are worried about shipping times. Without understanding the “why,” your solutions might address the symptom rather than the root cause.
Do’s vs Don’ts Comparison Table 📊
Refer to this summary table to quickly check your approach against best practices.
| Category | Do ✅ | Don’t ❌ |
|---|---|---|
| Data Source | Use interviews, analytics, and support logs. | Rely on assumptions or internal guesses. |
| Focus | Focus on customer actions and emotions. | List internal employee tasks and processes. |
| Structure | Allow for non-linear paths and loops. | Force a perfectly linear, step-by-step flow. |
| Persona | Target specific user segments. | Aim to map every single user type at once. |
| Updates | Treat as a living document for regular reviews. | Create once and archive indefinitely. |
| Feedback | Highlight pain points and negative emotions. | Sanitize data to show only positive experiences. |
How to Conduct Effective Customer Research 🔍
Research is the foundation of your map. Without it, you are drawing a map of a country you have never visited. Here is how to gather the necessary intelligence.
Qualitative Methods
Qualitative research helps you understand the “why” behind user behavior.
- Contextual Inquiry: Observe users in their natural environment as they interact with your product.
- Diary Studies: Ask users to record their interactions and feelings over a period of time.
- 1-on-1 Interviews: Conduct deep-dive conversations to uncover motivations and barriers.
Quantitative Methods
Quantitative research validates the scale of the issues found in qualitative research.
- Web Analytics: Analyze heatmaps and click paths to see where users drop off.
- Surveys: Use Net Promoter Score (NPS) or Customer Satisfaction (CSAT) surveys at key touchpoints.
- A/B Testing: Test different versions of a page to see which performs better for specific segments.
Visualizing the Data: Layout and Flow 📊
Once you have the data, you need to present it clearly. The visual design of the map matters as much as the content. If stakeholders cannot read it easily, they will not use it.
- Horizontal Flow: Most maps work best when time flows from left to right. This aligns with natural reading patterns.
- Layered Information: Use rows to separate different types of data (e.g., one row for Actions, one for Thoughts, one for Emotions).
- Color Coding: Use colors to indicate status. For example, red for pain points and green for moments of delight.
- Accessibility: Ensure the visual elements are clear and legible. Avoid clutter.
The layout should guide the viewer through the narrative. Start with the trigger that initiates the journey and end with the outcome. Ensure that the connection between stages is logical.
Keeping the Map Alive: Maintenance and Updates 🔄
A journey map is never truly finished. Markets change, and so do customer expectations. To maintain relevance:
- Set Review Cycles: Schedule quarterly or biannual reviews to update the map.
- Monitor Metrics: Track key performance indicators (KPIs) associated with specific journey stages. If a metric drops, investigate the map.
- Integrate with Product Roadmaps: Ensure that insights from the map translate into actual product changes or process improvements.
- Share Widely: Make the map accessible to all relevant teams. If only one person owns it, it becomes a bottleneck.
Measuring Success After Mapping 📈
How do you know if the mapping process was successful? Look for changes in operational metrics and customer sentiment.
- Reduced Churn: If you addressed pain points, retention rates should improve.
- Higher Conversion: Optimizing the purchase path should lead to more completed transactions.
- Faster Resolution: Support tickets should take less time to resolve if friction is removed.
- Improved NPS: Overall customer satisfaction scores should trend upward.
Success is not just having a pretty diagram. It is seeing measurable improvements in how customers interact with your business. If the map does not lead to action, it has not served its purpose.
Final Thoughts on Execution 🚀
Building a customer journey map is a disciplined process that requires empathy, data, and collaboration. By following the do’s and avoiding the don’ts outlined in this guide, you can create a resource that genuinely improves the customer experience. Remember that the map is a tool for understanding, not just a deliverable for presentation. Use it to drive change, align teams, and ultimately deliver value to the people you serve.
Start by gathering your data today. Identify one persona and one specific journey. Build the first draft, review it with your team, and begin iterating. The journey to better customer experience begins with a single, well-mapped step.

