In the modern business landscape, understanding the customer is not just a nice-to-have; it is a fundamental requirement for survival. Every interaction a person has with your brand—from the first time they hear your name to the moment they recommend you to a friend—shapes their perception and their loyalty. To navigate this complex web of interactions, professionals utilize a strategic tool known as a customer journey map.
This guide provides a comprehensive overview of what customer journey mapping entails, why it is critical for organizational growth, and a step-by-step process to build one effectively. We will explore the psychology behind customer decisions, the anatomy of a successful map, and common pitfalls to avoid. By the end of this article, you will have a clear understanding of how to visualize the customer experience and identify opportunities for improvement.
What is Customer Journey Mapping? 🤔
A customer journey map is a visual representation of every experience your customers have with you. It tracks their journey through the entire relationship, from the initial contact to the final purchase and beyond. This process involves creating a narrative that places the customer at the center of the business strategy.
It is important to distinguish this from a simple sales funnel. While a funnel focuses on conversion rates and stages of acquisition, a journey map focuses on the emotional and practical experience of the individual. It answers questions like:
- How does the customer feel at each stage?
- What are they trying to accomplish?
- Where do they encounter friction?
- What channels do they use to communicate?
By visualizing these elements, organizations can align their teams around a shared understanding of the customer. It transforms abstract data into a human story, making it easier for stakeholders to empathize with the user base.
Why This Process Matters 💡
Implementing a journey mapping strategy offers tangible benefits that extend beyond simple visualization. When teams understand the full scope of the customer experience, they can make more informed decisions. Here are the core advantages:
- Enhanced Empathy: It forces employees to step outside their departmental silos and see the world through the eyes of the user.
- Identified Gaps: You can spot disconnects between what customers expect and what they actually receive.
- Improved Retention: By fixing pain points, you reduce churn and increase the lifetime value of each customer.
- Better Alignment: Marketing, sales, support, and product teams can work from a single source of truth.
Without this visibility, companies often optimize for their own convenience rather than customer needs. A map ensures that internal processes serve external goals.
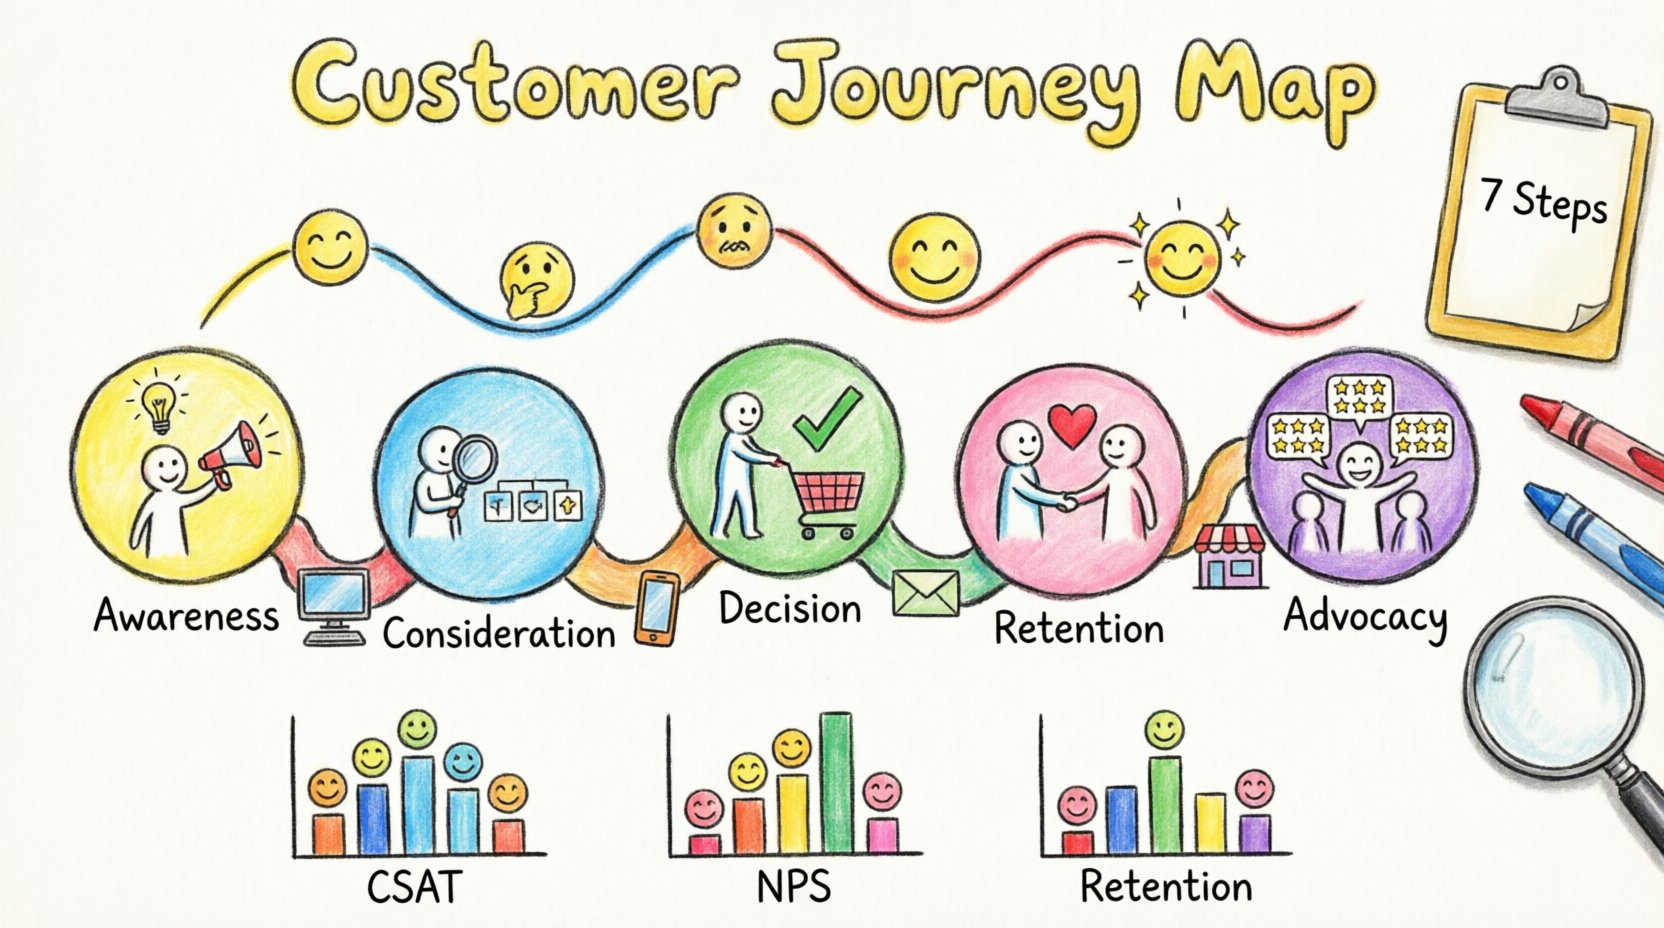
The 5 Stages of the Customer Journey 🔄
While every industry differs, most customer journeys follow a standard progression. Understanding these phases helps you categorize interactions and tailor your messaging appropriately.
1. Awareness 📢
This is where the customer realizes they have a problem or a need. They might search for a solution online, hear a recommendation, or see an advertisement. At this stage, your goal is to be visible and relevant. They are looking for information, not necessarily a purchase.
2. Consideration 💭
Now that they know they have a need, they are evaluating options. They compare features, read reviews, and look at pricing. Trust becomes the primary currency here. Your content needs to demonstrate expertise and reliability.
3. Decision 🛒
The customer is ready to buy. They are looking for reassurance that this is the right choice. Friction at this stage—such as a confusing checkout process or hidden fees—can cause them to abandon the transaction.
4. Retention 🤝
The relationship does not end at the sale. This stage involves onboarding, usage, and support. A positive experience here encourages repeat business. It is often cheaper to retain an existing customer than to acquire a new one.
5. Advocacy 📣
Happiest customers become promoters. They share their positive experiences with others, write reviews, and refer friends. This is the organic growth engine of any business.
Mapping the Stages in Practice
To visualize how these stages interact with specific actions, refer to the table below.
| Stage | Customer Goal | Key Channel | Potential Pain Point |
|---|---|---|---|
| Awareness | Find a solution | Social Media, Search | Too much noise, unclear messaging |
| Consideration | Compare options | Website, Reviews | Confusing features, lack of proof |
| Decision | Complete purchase | Checkout, Sales Rep | Hidden costs, complex forms |
| Retention | Use product effectively | Email, Support Chat | Slow response times, bugs |
| Advocacy | Share experience | Referral Program, Social | No incentive to share, poor follow-up |
How to Build Your Map 🛠️
Creating a map is a collaborative effort that requires research, data analysis, and design. You cannot simply guess what the customer experiences; you must verify it with evidence. Follow this structured approach to ensure accuracy.
Step 1: Define Your Scope and Goals 🎯
Before drawing a single line, determine the purpose of the map. Are you trying to improve the onboarding process? Are you launching a new product? Is the goal to reduce support tickets? Defining the scope prevents the project from becoming too broad and unmanageable. A map of the entire lifecycle is valuable, but a map of a specific high-friction flow often yields quicker wins.
Step 2: Gather Data 🔍
Qualitative and quantitative data must inform your map. Relying solely on internal assumptions leads to bias. Use the following methods to collect insights:
- Customer Interviews: One-on-one conversations provide deep context on motivations and frustrations.
- Surveys: Quantitative data helps validate trends across a larger population.
- Support Logs: Analyze tickets to find recurring issues.
- Analytics: Look at drop-off rates on your website or app.
- Sales Calls: Record what prospects ask about before they buy.
Step 3: Create Buyer Personas 👤
A journey map is not for everyone; it is for specific types of customers. Define who you are mapping for. Consider demographics, job roles, technical proficiency, and business goals. For example, a map for a CTO buying enterprise software will look very different from one for a junior developer.
Each persona represents a distinct path. You may need multiple maps for different user types to capture the full spectrum of experiences.
Step 4: Map the Touchpoints 📍
A touchpoint is any interaction a customer has with your brand. List every single point of contact across all channels. These include:
- Website landing pages
- Email newsletters
- Social media posts
- Phone calls with support
- Physical product packaging
- Advertising campaigns
Ensure you account for both digital and physical interactions. Missing a physical touchpoint can leave a gap in your understanding of the experience.
Step 5: Document Actions, Thoughts, and Emotions 🧠
For each stage and touchpoint, write down what the customer is doing, thinking, and feeling. The emotional curve is often the most critical part of the map.
- Actions: What physical step are they taking? (e.g., “Clicks ‘Add to Cart'”)
- Thoughts: What is running through their mind? (e.g., “Is this secure?”)
- Emotions: How do they feel? (e.g., “Anxious”, “Excited”, “Frustrated”)
Step 6: Identify Pain Points and Opportunities 🔎
Review the map with a critical eye. Where does the emotion dip? Where do actions stall? These are your pain points. Conversely, look for moments of delight where the emotion peaks. These are your opportunities to reinforce positive behavior.
Step 7: Share and Iterate 🔄
A map is a living document, not a static artifact. Share it with cross-functional teams to gather feedback. As you make changes to the product or service, update the map to reflect the new reality. Regular reviews ensure the map remains accurate over time.
Key Components of a Successful Map 📝
To ensure your map is actionable, it must contain specific elements. A visual that only shows stages is insufficient. You need depth.
- Persona Profile: Name, photo, and background info of the user.
- Scenario: The specific context of the journey (e.g., “First-time purchase” vs. “Renewal”).
- Phases: The timeline of the journey.
- Touchpoints: Where the interaction happens.
- Channels: The medium used (web, mobile, in-person).
- Emotional State: A line graph or indicators showing sentiment.
- Internal Actions: What your team needs to do to support the user.
Common Mistakes to Avoid ⚠️
Even experienced teams can fall into traps when creating these visualizations. Being aware of these common errors can save you time and resources.
1. Designing for Yourself
It is easy to assume the customer knows what you know. This internal bias leads to maps that reflect your internal workflow rather than the customer’s reality. Always validate your assumptions with real user data.
2. Ignoring the Channels
Customers do not switch channels in a vacuum. They might see an ad on social media, visit the site on mobile, and call support on their laptop. Failing to map cross-channel behavior creates a fragmented view of the experience.
3. Treating It as a One-Off Project
Once the map is created, the work is not done. If you do not use it to drive decisions, it becomes a shelf-ware exercise. Integrate the insights into your product roadmap and operational planning.
4. Overcomplicating the Visuals
A map should be clear and understandable at a glance. Using too much text or complex graphics can obscure the insights. Keep the design simple and focus on the narrative flow.
5. Focusing Only on the Positive
It is tempting to highlight only the good parts of the journey. However, the value of a map lies in exposing the friction. Do not shy away from documenting negative experiences; they are the biggest opportunities for improvement.
Measuring Success and KPIs 📊
Once you have implemented changes based on your map, you need to measure the impact. Use the following key performance indicators to track progress.
- Customer Satisfaction Score (CSAT): Measures satisfaction at specific touchpoints.
- Net Promoter Score (NPS): Measures overall loyalty and likelihood to recommend.
- Customer Effort Score (CES): Measures how easy it is for customers to get things done.
- Churn Rate: Tracks how many customers stop using your service.
- Conversion Rate: Tracks the percentage of users who complete the desired action.
- Time to Value: How long it takes for a customer to realize the benefit of your product.
By monitoring these metrics, you can determine if your journey mapping efforts are translating into business results. If a specific pain point is addressed, you should see a corresponding improvement in these metrics over time.
Final Thoughts on Customer Experience 🌟
Customer journey mapping is more than a diagram; it is a mindset. It shifts the focus from selling products to solving problems for people. In an era where customers have endless choices, the quality of the experience is often the deciding factor in brand loyalty.
Start small. Pick one critical journey and map it out thoroughly. Gather the data, engage your team, and implement changes. As you become more proficient, you can expand to cover the entire ecosystem of your business. The investment in understanding your customer pays dividends in retention, revenue, and reputation.
Remember that the journey is never truly finished. As your market evolves and your customers change, your map must evolve with them. Keep listening, keep learning, and keep refining the path you provide for your users.

