In the fast-paced world of digital product development, understanding the market landscape is not optional; it is foundational. For UX designers and product strategists, competitive analysis serves as a critical compass. It guides decisions regarding feature prioritization, user flow optimization, and visual direction. Without this intelligence, teams risk building solutions that are redundant or misaligned with user expectations established by the market.
This guide details a rigorous approach to conducting a competitive analysis specifically tailored for product strategy. We move beyond surface-level feature comparisons to uncover deeper patterns in user experience, interaction design, and business logic. By integrating these insights, teams can make informed choices that differentiate their product while mitigating risk.
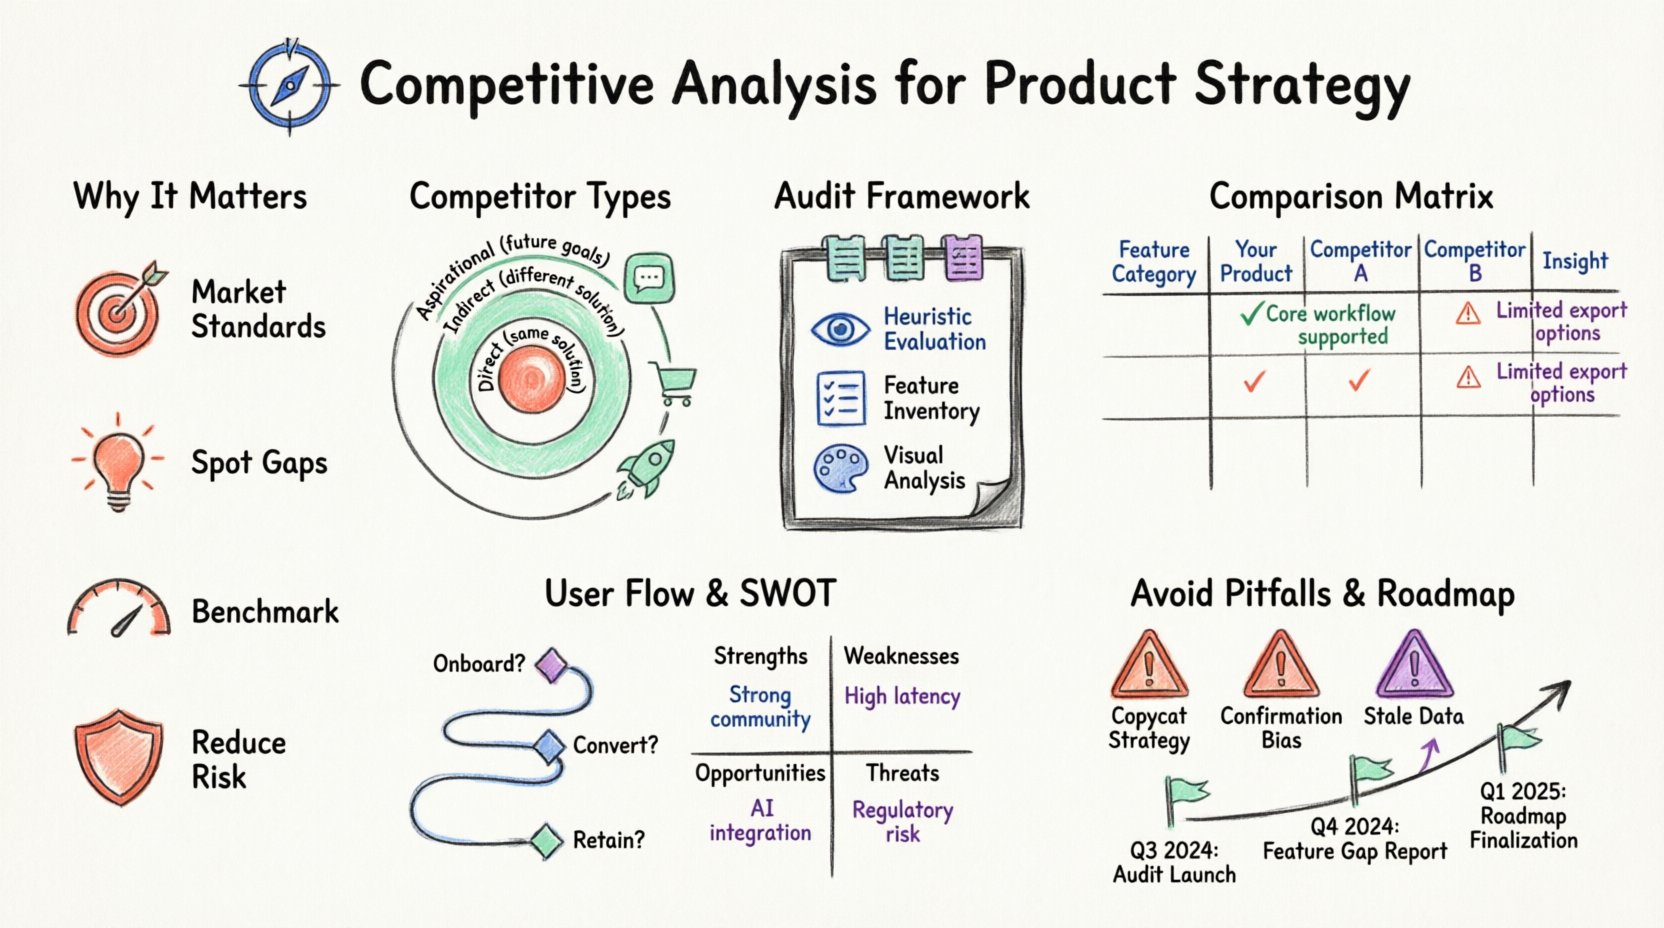
Why Competitive Analysis Matters in UX 🧭
Many teams approach design through a lens of internal ambition, assuming their solution is the best path forward. This internal focus often leads to reinventing the wheel or overlooking established user mental models. A structured analysis process addresses several key challenges:
- Identifying Market Standards: Users have expectations based on their interactions with other platforms. Understanding these norms prevents friction.
- Spotting Gaps: Analyzing where competitors fall short reveals opportunities for innovation.
- Benchmarking Performance: Establishing metrics for speed, accessibility, and conversion allows for objective progress tracking.
- Reducing Risk: Validating that a feature exists in the market before investing significant engineering resources.
The goal is not to copy existing designs but to understand the why behind them. When a competitor places a checkout button in a specific location, there is likely a data-backed reason. Your job is to discover that reason and determine if it applies to your specific context.
Defining the Scope and Goals 🔍
Before examining any product, you must define the boundaries of your investigation. A broad sweep often yields shallow insights. A focused audit produces actionable strategy. Start by answering the following questions:
- What is the core problem? Are you solving a specific pain point or trying to capture a new market segment?
- Who is the target audience? Demographics, psychographics, and technical proficiency levels matter.
- What is the success metric? Is it user retention, conversion rate, or task completion time?
- What is the timeline? A deep dive takes time; ensure the schedule allows for thorough research.
Set clear objectives for the analysis. For example, “We need to understand how competitors handle user onboarding to reduce drop-off rates” is better than “We need to look at the competition.” Specific objectives drive specific data collection.
Categorizing Your Competitors 📊
Not all competitors are created equal. In the context of product strategy and UX, you should categorize them into three distinct groups. This distinction helps in analyzing different types of data and setting appropriate benchmarks.
1. Direct Competitors
These are companies offering the same solution to the same target audience. They compete for the same users and solve the same problems. Their user interface patterns will be very similar to yours.
- Focus: Feature parity, pricing models, and direct user experience differences.
- Example: If you are building a task management app, other task management apps are direct competitors.
2. Indirect Competitors
These companies solve the same problem but with a different solution or for a slightly different audience. They might offer a workaround rather than a dedicated tool.
- Focus: Alternative workflows and user motivation.
- Example: For a task management app, a generic spreadsheet or a note-taking app serves as an indirect competitor.
3. Aspirational Competitors
These are companies that do not currently offer your specific product but have the resources or market position you aspire to achieve. They often set the standard for innovation in the broader industry.
- Focus: Vision, brand voice, and emerging trends.
- Example: A startup might look at a tech giant to understand future scaling capabilities.
The Audit Framework: Gathering Data 📝
Once you have identified the relevant products, you need a systematic method to collect data. Relying on memory or casual browsing introduces bias. Use a structured framework to capture details consistently across all targets.
Heuristic Evaluation
Apply established usability principles to evaluate the user experience. Look for specific issues in the following areas:
- Visibility of System Status: Does the user know what is happening?
- Match Between System and Real World: Does the language match user expectations?
- User Control and Freedom: Can users undo actions easily?
- Consistency and Standards: Do elements behave predictably?
- Error Prevention: Does the design stop mistakes before they happen?
Feature Inventory
Create a comprehensive list of functionalities. This goes beyond the homepage. Check settings pages, onboarding flows, and help documentation. Document the following:
- Core Features: The primary capabilities of the product.
- Secondary Features: Value-add tools that enhance the core experience.
- Missing Features: What users ask for that is not available?
Visual and Interaction Analysis
Examine the visual language and interaction design. This includes:
- Typography: Font choices, hierarchy, and readability.
- Color Palette: How color is used to denote status or action.
- Navigation: Menu structures and information architecture.
- Micro-interactions: Animations, feedback loops, and transitions.
Comparative Analysis Matrix 📈
Data collection is only half the battle. Synthesis is where strategy emerges. The most effective way to visualize this data is through a comparison matrix. This table allows stakeholders to see gaps and overlaps at a glance.
Below is an example structure for a feature comparison matrix:
| Feature Category | Your Product | Competitor A | Competitor B | Insight |
|---|---|---|---|---|
| Onboarding Flow | Yes (Step-by-step) | No (Immediate access) | Yes (Interactive) | Competitor A loses users who need guidance. Consider a hybrid approach. |
| Mobile Support | Yes (Native App) | Yes (Responsive Web) | No | Mobile is a requirement for the market. Competitor B is at a disadvantage. |
| Collaboration Tools | Coming Soon | Yes (Real-time) | Yes (Async) | Collaboration is a key differentiator. Prioritize real-time updates. |
| Pricing Model | Free Tier + Subscription | Free Trial Only | One-time Purchase | Subscription is the market standard. Free trial may deter adoption. |
When creating your own matrix, ensure the columns represent the specific competitors you selected and the rows represent the functional or experiential criteria you defined in your scope. The “Insight” column is crucial; do not just list facts, explain what they mean for your strategy.
Deep Dive into User Flows 🔄
Features are static; user flows are dynamic. To truly understand a competitor’s strategy, you must map out the critical paths a user takes to complete a task. This often reveals hidden complexities or elegant simplifications.
Mapping the User Journey
Select a primary task, such as “Sign Up” or “Complete Purchase.” Walk through this process on each competitor’s platform. Document every screen, decision point, and error state. Pay attention to:
- Friction Points: Where do users hesitate or encounter errors?
- Assistance: Is help available when needed? Is it contextual?
- Progress Indicators: Do users know how far they are from the goal?
- Feedback: Does the system confirm actions immediately?
Visualizing the Flow
Use diagrams to represent these journeys. A simple flowchart can highlight differences in logic. For instance, one competitor might require email verification before creating an account, while another allows a guest checkout. These differences reflect trust models and conversion strategies.
Compare your current flow with these findings. If your flow is significantly longer than the market average, investigate why. If it is shorter, ensure you haven’t sacrificed security or clarity.
Analyzing Content and Messaging 📢
Product strategy is not just about functionality; it is about communication. How a competitor speaks to users influences how they perceive value. Analyze the copy and tone of voice across their platforms.
Tone and Voice
- Formal vs. Casual: Does the brand feel corporate or friendly?
- Jargon Usage: Do they use industry terms or plain language?
- Emotional Appeal: Do they focus on efficiency, joy, or security?
Value Proposition
Examine the homepage and landing pages. What is the first thing they promise? Is it speed, cost savings, or ease of use? This tells you what the market values most. If all competitors focus on speed, your product might win by focusing on reliability instead.
SWOT Analysis for Product Strategy 📉
After gathering data on features, flows, and messaging, consolidate findings into a SWOT analysis. This framework helps translate research into strategic action.
- Strengths: Internal capabilities that are superior to competitors.
- Weaknesses: Internal gaps where competitors outperform you.
- Opportunities: Market needs that competitors are ignoring.
- Threats: External factors where competitors pose a risk.
For example, a Strength might be a proprietary algorithm, while a Threat could be a new entrant with a freemium model. Use this analysis to prioritize your roadmap. Focus on leveraging Strengths and exploiting Opportunities while addressing Weaknesses and mitigating Threats.
Common Pitfalls to Avoid ⚠️
Conducting a competitive analysis is straightforward in theory but prone to errors in practice. Be mindful of these common traps:
- Copycat Syndrome: Adopting features simply because competitors have them, without understanding the underlying user need. Innovation requires context.
- Recency Bias: Focusing only on the latest release. Consider the historical evolution of a product to understand its trajectory.
- Ignoring Non-Digital Competitors: In some industries, manual processes or offline tools are the primary competition.
- Over-reliance on Quantitative Data: Metrics like traffic are useful, but qualitative UX feedback provides the “why.”
- Stale Data: The market changes rapidly. Ensure your analysis is current. Revisit the audit quarterly.
Integrating Insights into the Roadmap 🗺️
Research that sits in a document is wasted effort. The output of this analysis must feed directly into your product planning. Translate findings into user stories, epics, or strategic themes.
Prioritization Frameworks
Use a scoring system to decide which insights warrant immediate attention. Consider:
- User Impact: How many users will this affect?
- Effort: How much engineering time is required?
- Strategic Value: Does this align with long-term goals?
Stakeholder Communication
Present your findings clearly. Executives need to understand the business risk of ignoring the market. Designers need to understand the UX patterns to adopt. Tailor the presentation format to the audience. Use the comparison matrix for visual learners and the SWOT for strategic thinkers.
Measuring the Impact of Changes 📏
Once you implement changes based on your analysis, you must measure the outcome. Did the new onboarding flow reduce drop-off? Did the revised pricing model increase conversions? Establish baselines before making changes so you can quantify improvement.
This creates a feedback loop. The product evolves, the market evolves, and your analysis must evolve with it. Continuous monitoring ensures your strategy remains relevant.
Conclusion on Strategic Iteration 🔄
Competitive analysis is not a one-time event; it is a discipline. It requires constant vigilance and a willingness to adapt. By systematically evaluating the landscape, categorizing competitors, and synthesizing data into actionable strategy, teams can build products that resonate deeply with users. The market is dynamic, and so must be your approach. Stay curious, stay rigorous, and let data drive your design decisions.
Remember, the goal is not to be better than everyone else in every way. It is to be the best fit for your specific users at this specific moment. Use this guide to build that fit, one insight at a time.

