Creating clear visual representations of software behavior is a cornerstone of effective system design. Among the various diagram types available, the Interaction Overview Diagram offers a unique bridge between high-level workflows and detailed interaction sequences. However, many newcomers struggle with this specific notation. The confusion often stems from not understanding the distinct purpose of this diagram compared to standard activity or sequence diagrams.
This guide explores the most frequent errors encountered when building these diagrams. By understanding these pitfalls, you can ensure your designs communicate intent accurately without introducing ambiguity. We will cover technical nuances, structural logic, and best practices for maintaining clarity throughout your documentation.
🧠 Understanding the Interaction Overview Diagram
Before diving into what can go wrong, it is essential to define what this diagram actually represents. An Interaction Overview Diagram is a specialized type of activity diagram. Its primary function is to show the control flow between interaction fragments or between a high-level activity and a detailed sequence diagram.
Think of it as a map of maps. Instead of drawing every single interaction in one large, tangled web, you break the process down into distinct steps. Each step in the overview diagram points to a more detailed interaction or a specific behavior. This modular approach allows teams to manage complexity. It separates the what (the flow of logic) from the how (the specific message passing details).
When modeling correctly, this diagram serves as a navigation tool for developers and stakeholders. It answers questions like, “What happens first?” and “Where does the process branch off?” If the diagram fails to answer these questions clearly, the modeling process has likely missed a fundamental rule.
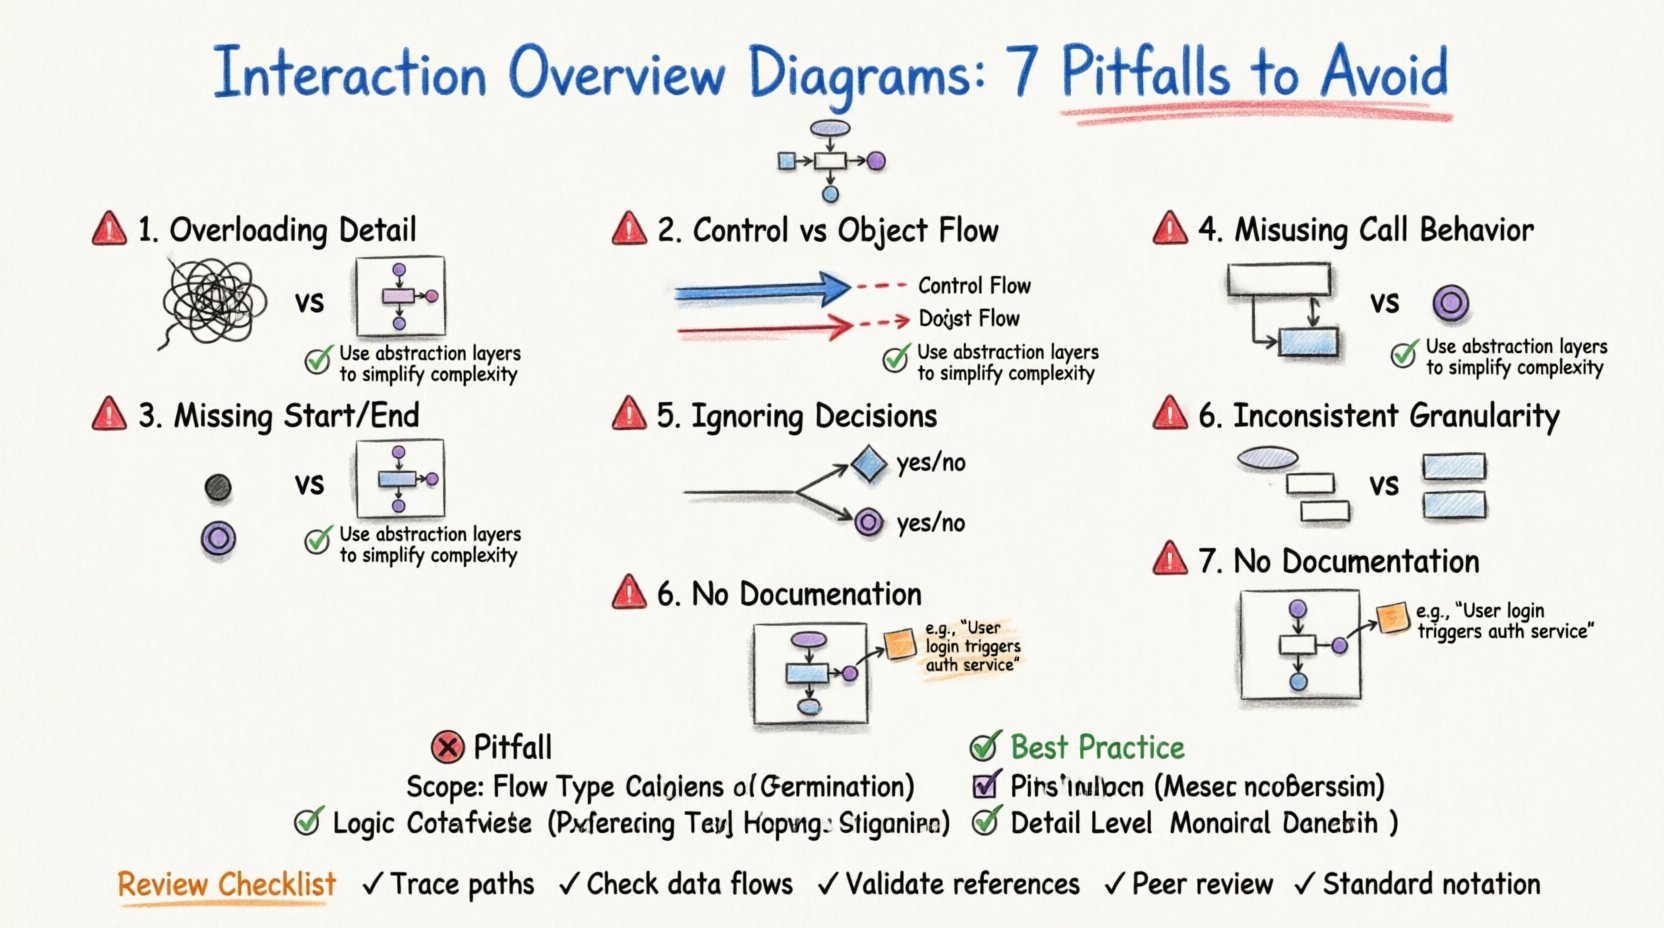
⚠️ Mistake 1: Overloading the Diagram with Detail
The most common error beginners make is trying to fit too much information into a single overview. The temptation is to show every step, every message, and every variable change. This approach defeats the purpose of having an overview.
The Problem: When you include granular details, the diagram becomes cluttered. Lines cross over each other, making the flow impossible to trace visually.
The Impact: Stakeholders cannot grasp the high-level logic. Developers get lost in the noise and miss the critical path.
The Solution: Use the diagram to show the sequence of major activities. If a step requires deep detail, reference a separate interaction diagram instead.
Use the Call Behavior Action to delegate complex logic to another diagram. This keeps the overview clean. Each node in the overview should represent a significant milestone or a complete sub-process, not a single method call or variable assignment.
⚠️ Mistake 2: Confusing Control Flow with Object Flow
UML notation distinguishes clearly between how control moves and how data moves. Beginners often blur these lines. Control flow dictates the order of execution. Object flow dictates the movement of data or state between objects.
Control Flow: Represented by solid lines with arrowheads. It shows the sequence of actions.
Object Flow: Represented by dashed lines with open arrowheads. It shows data passing between actions.
If you mix these up, the logic of the system becomes ambiguous. A developer reading the diagram might not know if a specific action depends on the completion of a previous one, or if it simply needs data from it. Always ensure that decision nodes and merge nodes are connected via control flow lines. Data objects should be clearly labeled when they are inputs or outputs of a specific action.
⚠️ Mistake 3: Ignoring Entry and Exit Points
Every activity diagram, including interaction overviews, must have a defined start and a defined end. Beginners often create fragments of logic without anchoring them to a beginning or a conclusion. This leaves the system behavior undefined.
Initial Node: A solid black circle. This indicates where the process begins.
Final Node: A black circle surrounded by a ring. This indicates where the process successfully ends.
Final Activity Node: A black circle with a thick ring. This indicates where the process ends, often signaling an exception or termination.
Without these nodes, the diagram is incomplete. It is impossible to determine if the system recovers from an error or if it halts indefinitely. Ensure that every path in your diagram eventually leads to a final node. Dead ends are logical errors in the model.
⚠️ Mistake 4: Misusing Call Behavior Actions
The Call Behavior Action is a powerful tool for linking high-level flows to detailed sequences. However, it is frequently misused. Some modelers treat it as a simple button click, ignoring the parameters and return values.
Context Matters: When calling a behavior, specify the parameters required. This ensures the receiving diagram knows what data to expect.
Return Values: Define what data is passed back to the overview. This is crucial for subsequent decision nodes.
Consistency: Ensure the name of the behavior in the overview matches the name in the detailed diagram exactly.
If you call a behavior without defining its contract, the model becomes a collection of disconnected pieces. Integration testing will fail because the expectations set by the overview do not match the reality of the detailed design.
⚠️ Mistake 5: Neglecting Decision and Merge Nodes
Real-world software is rarely linear. It involves conditions, loops, and branching paths. Beginners often draw straight lines from start to finish, ignoring the complexity of logic.
Decision Nodes: Represented by a diamond. They route the flow based on a condition (e.g., “Is User Logged In?”).
Merge Nodes: Also represented by a diamond, but used to combine flows that split earlier.
Failing to include these nodes creates a false sense of simplicity. If a user enters invalid data, where does the flow go? If a service times out, is there an alternative path? You must model the failure states. A robust diagram accounts for success, partial success, and failure.
⚠️ Mistake 6: Inconsistent Granularity
Granularity refers to the level of detail in your nodes. A common pitfall is mixing high-level business steps with low-level technical steps within the same diagram. For example, one node might say “Process Order” while another says “Validate Credit Card Number.”
The Issue: “Process Order” is a business concept. “Validate Credit Card Number” is a technical implementation detail.
The Fix: Keep the overview focused on business logic or architectural milestones. Let the detailed diagrams handle the technical validation steps.
This inconsistency confuses the audience. Business stakeholders cannot understand the technical implementation, and developers get bogged down in business rules. Align the granularity with your audience. For a technical design review, use consistent technical terms. For a business review, use consistent business terms.
⚠️ Mistake 7: Lack of Documentation and Notes
Diagrams are visual aids, not complete specifications. Beginners often assume the visual symbols explain everything. They forget to add notes, comments, or documentation to clarify context.
Clarity: Use notes to explain complex rules that are hard to represent with standard symbols.
Versioning: Add metadata to the diagram indicating the version and the date of creation.
Assumptions: Document any assumptions made during the design process. This prevents future developers from guessing.
A diagram without context is a riddle. A diagram with context is a tool. Always include a legend or a key if you use non-standard notation. This ensures that anyone reading the document, even months later, understands the intent.
📊 Comparison: Good Practices vs. Common Pitfalls
To help you quickly identify where your modeling might be drifting, refer to the following comparison table. This highlights the contrast between effective design and common beginner errors.
Aspect | ❌ Common Pitfall | ✅ Best Practice |
|---|---|---|
Scope | Includes every single message exchange. | Shows high-level flow between major components. |
Flow Type | Uses solid lines for data movement. | Uses solid lines for control, dashed for data. |
Termination | Ends abruptly without a final node. | Explicitly marks success and error exit points. |
Detail Level | Mixes business and technical steps. | Keeps granularity consistent throughout. |
References | Hardcodes internal logic details. | Uses Call Behavior Actions for delegation. |
Logic | Assumes only one successful path. | Models decision nodes for branching logic. |
🛠️ Practical Steps for Reviewing Your Model
Once you have created your initial draft, do not assume it is correct. Perform a systematic review to catch errors before sharing them with the team.
Trace the Path: Start at the initial node. Follow every line to the end. Does every path reach a final node? If you hit a wall, you have an error.
Check the Data: Look at every action. Does it have the required inputs? Does it produce the expected outputs? Ensure data flows match the control flows.
Validate the References: Click on every Call Behavior Action. Does the target diagram exist? Is the signature correct?
Review with Peers: Show the diagram to someone who did not create it. Can they explain the flow without asking you questions? If they are confused, the diagram is not clear enough.
Check Notation: Ensure all symbols match the standard UML notation. Do not invent new shapes unless absolutely necessary, and document them if you do.
🔍 The Impact of Poor Modeling
Why does this matter? In software development, communication is the primary currency. If the design is unclear, the implementation will suffer. Poor modeling leads to:
Increased Rework: Developers implement logic that contradicts the design. This requires costly refactoring later.
Integration Failures: Different teams build components that do not fit together because the interaction rules were ambiguous.
Lost Knowledge: When a diagram is incomplete, new team members cannot onboard effectively. They have to guess how the system works.
Testing Gaps: If the interaction overview does not show error paths, testers will not know to test for those scenarios.
Investing time in a clean, accurate interaction overview saves significant time during the coding and testing phases. It acts as a contract between the design team and the implementation team.
🚀 Moving Forward with Confidence
Modeling is a skill that improves with practice. Start by focusing on the basics: clear start and end points, consistent flow lines, and appropriate use of delegation. Avoid the urge to show everything at once. Simplicity is the highest form of sophistication in system design.
By avoiding the common mistakes outlined in this guide, you will create diagrams that are not just technically correct, but also useful. Your diagrams will serve as reliable references throughout the lifecycle of the project. They will guide development, inform testing, and help stakeholders understand the system architecture.
Remember, the goal is clarity. If a diagram is easy to read, it is likely well-designed. If it is confusing, it needs revision. Take the time to refine your models. Your future self and your team will thank you for the precision.

