In modern product development, a persistent friction exists between the team gathering insights and the team creating solutions. Researchers collect data, interviews, and analytics, while designers craft interfaces, flows, and interactions. When these two groups do not speak the same language, valuable information is lost, and the final product often misses the mark. The customer journey map serves as the critical translator in this process. It transforms raw data into a visual narrative that both sides can understand, reference, and act upon.
This guide explores how to effectively use journey mapping to align research findings with design decisions. We will examine the structure of a map, the specific data required, and the collaborative processes needed to ensure the insights drive tangible outcomes. The goal is not just to create a document, but to build a shared understanding of the user.
🌉 Understanding the Chasm Between Research and Design
Research teams often operate in silos, producing reports filled with statistics and quotes that designers may not have time to digest deeply. Conversely, design teams may work from assumptions or gut feelings rather than evidence. This disconnect leads to:
- Fragmented User Experience: Features work well in isolation but fail when integrated into the broader flow.
- Wasted Resources: Designing solutions for problems that are not actually critical to the user.
- Stakeholder Frustration: Business goals are met, but user satisfaction remains stagnant.
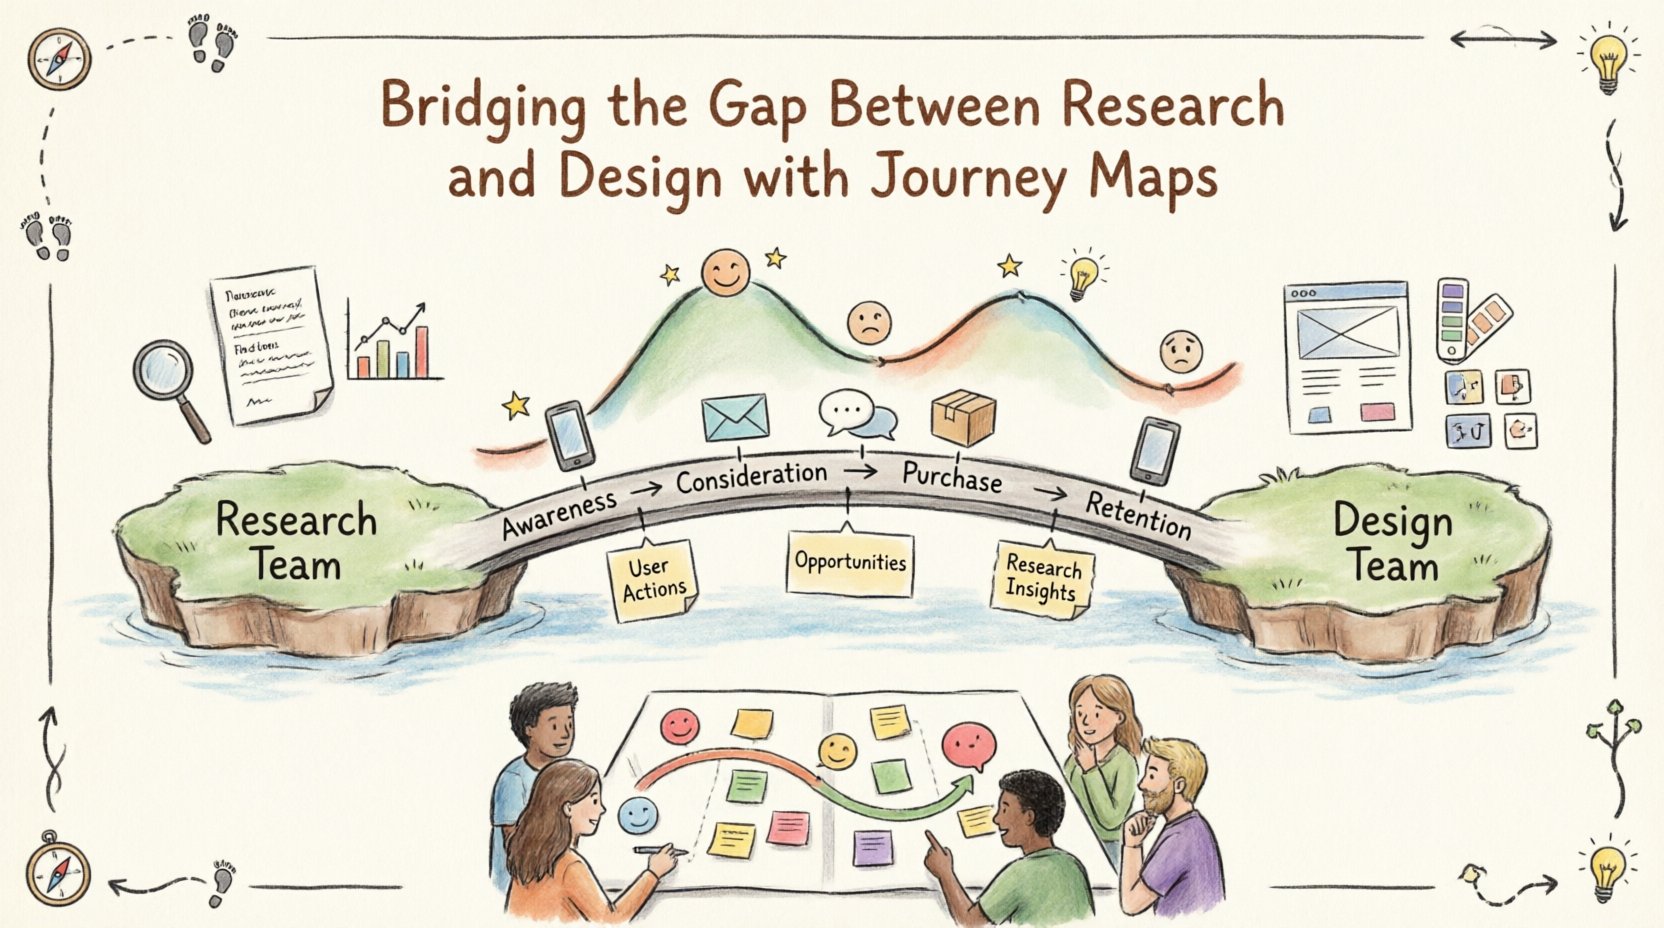
A journey map bridges this gap by visualizing the user’s experience over time. It moves beyond single data points to show the context in which decisions are made. It answers questions like: What is the user feeling at this specific moment? Why are they abandoning the process here? What support do they need?
🤔 What is a Customer Journey Map?
A customer journey map is a visual representation of every experience your user has with you. It documents the stages of the relationship, from initial awareness to post-purchase support. It is not merely a flowchart of clicks; it is a narrative that includes emotional states, touchpoints, and underlying pain points.
Effective maps typically include the following elements:
- Phases: The high-level stages of the relationship (e.g., Awareness, Consideration, Purchase, Retention).
- Touchpoints: The specific interactions where the user engages with your product or service.
- User Actions: What the user is actually doing at each step.
- Emotions: The user’s sentiment or frustration level at each step.
- Opportunities: Areas where design can improve the experience.
By combining qualitative research (interviews, observations) with quantitative data (analytics, conversion rates), the map becomes a single source of truth.
🔬 Phase 1: Grounding in Research
The foundation of any successful journey map is high-quality research. Without accurate data, the map becomes a fictional story rather than a strategic tool. This phase focuses on gathering the raw materials needed to construct the narrative.
Gathering Qualitative Data
Qualitative research provides the depth and context that numbers cannot. To build an authentic map, you need to understand the user’s motivations and feelings.
- One-on-One Interviews: Conduct in-depth conversations to uncover the “why” behind user behaviors.
- Contextual Inquiry: Observe users in their natural environment while they perform tasks.
- Diary Studies: Ask users to log their experiences over a period of time to capture longitudinal data.
- Usability Testing: Watch users interact with current solutions to identify friction points.
Integrating Quantitative Data
While qualitative data tells the story, quantitative data validates the scale of the issues. This ensures that the design team prioritizes problems affecting the most users.
- Analytics: Use web or app analytics to identify drop-off points and high-traffic areas.
- Survey Data: Leverage Net Promoter Score (NPS) or Customer Satisfaction (CSAT) scores to gauge sentiment.
- Support Tickets: Analyze customer service logs to find recurring technical or usability issues.
- A/B Test Results: Review past experiments to see what changes actually improved performance.
📊 Comparing Research Artifacts to Design Needs
Understanding how different research outputs translate into design requirements is crucial. The table below illustrates common research findings and how they inform design decisions.
| Research Artifact | Key Insight Provided | Design Output |
|---|---|---|
| Interview Transcripts | User fears, motivations, language used | Persona Profiles, Copywriting Guidelines |
| Heatmaps | Where users click or scroll | Layout Adjustments, Call-to-Action Placement |
| Usability Testing | Specific steps where users get stuck | Flow Redesign, Micro-interactions |
| Customer Support Logs | Common errors and confusion points | Error Handling, Help Centers, Onboarding |
| Analytics Funnels | Where users drop off in volume | Process Simplification, Incentives |
💡 Phase 2: Translating to Design
Once the data is collected, the next step is synthesis. This involves organizing the information into a coherent story that highlights the highs and lows of the user experience. This phase is where the gap between research and design begins to close.
Defining the Persona
Every journey map belongs to a specific persona. A map for a new user differs significantly from one for a power user. Ensure the persona definition includes:
- Demographics (Age, Location, Role)
- Goals and Motivations
- Technical Proficiency
- Context of Use (Mobile, Desktop, On-the-go)
Mapping the Emotional Curve
One of the most powerful aspects of a journey map is the emotional line. This visualizes the user’s satisfaction level throughout the journey. It helps designers empathize with the user’s struggles.
Look for:
- Pain Points: Where does the curve dip? What is causing frustration?
- Delight Points: Where does the curve spike? What is creating a positive memory?
- Neutral Zones: Where does the user feel indifferent? Can this be improved?
Identifying Touchpoints
Touchpoints are the moments of contact between the user and the product. These can be digital (a button click, an email) or physical (a phone call, a package delivery). Mapping these ensures that the design accounts for the entire ecosystem, not just the application interface.
- Owned Channels: Your website, app, or internal tools.
- Partner Channels: Third-party integrations or service providers.
- External Channels: Social media, reviews, or word-of-mouth.
🤝 Collaborative Workshops: Bringing Teams Together
A journey map is rarely built by one person. It requires collaboration between researchers, designers, product managers, and stakeholders. Workshops are the most effective way to facilitate this alignment.
Workshop Preparation
Before the session, prepare the following materials:
- Research Synthesis: Compiled quotes, data points, and photos.
- Templates: Large paper sheets or digital canvases for the map.
- Sticky Notes: Different colors for different types of insights (e.g., pain points vs. opportunities).
- Markers and Pens: For annotation and drawing connections.
Running the Session
During the workshop, follow a structured process to keep the group focused:
- Set the Stage: Review the persona and the goal of the journey.
- Brainstorm Phases: Agree on the high-level stages of the journey.
- Plot Actions: List what the user does at each stage.
- Insert Insights: Add research findings, quotes, and data to specific steps.
- Draw the Curve: Map the emotional journey across the timeline.
- Identify Opportunities: Brainstorm design solutions for the identified pain points.
This collaborative approach ensures that the research is not just presented, but actively discussed and interpreted by the design team. It creates a sense of ownership across the organization.
⚠️ Common Pitfalls to Avoid
Even with the best intentions, journey mapping can go off track. Being aware of common mistakes helps maintain the integrity of the process.
- Creating for Yourself: Designing the map based on internal assumptions rather than user data. Always ground the map in evidence.
- Too Much Detail: A map that is too granular becomes unreadable. Focus on the high-level journey and specific critical moments.
- Static Documents: Treating the map as a one-time deliverable. It should be a living document that evolves as the product changes.
- Ignoring Negative Feedback: Focusing only on the success stories. The most valuable insights often come from the frustration points.
- Lack of Stakeholder Buy-in: If leadership does not understand the map, the insights will not be prioritized in the roadmap.
🔄 Keeping the Map Alive
A journey map is not a poster to hang on the wall and forget. It must be integrated into the daily workflow to remain relevant.
Integration Strategies
- Design Sprints: Use the map as the starting point for sprint planning.
- Design Reviews: Reference the emotional curve during design critiques to ensure new features do not degrade the experience.
- Onboarding: Use the map to train new team members on the user experience philosophy.
- Iteration Cycles: Update the map after major releases to reflect new user behaviors.
📊 Measuring Impact
How do you know if the journey map is working? Success is measured by the alignment of the team and the improvement of the user experience. Track the following metrics:
- Feature Adoption: Are users adopting the features designed based on the map?
- Task Success Rate: Have the friction points identified in the map been resolved?
- Team Alignment: Do stakeholders reference the map during decision-making?
- Customer Sentiment: Is there an improvement in NPS or CSAT scores over time?
🚀 Final Considerations
Bridging the gap between research and design requires more than just a document; it requires a cultural shift. When teams view the journey map as a shared tool for empathy rather than a deliverable for approval, the quality of the product improves. The map becomes a compass, guiding decisions toward what truly matters to the user.
By prioritizing data, fostering collaboration, and maintaining the map as a living resource, organizations can ensure that their design efforts are grounded in reality. The result is a seamless experience that resonates with users and drives business value.
Start small. Pick a single journey, gather the research, and bring the teams together. The clarity gained from this process will pay dividends in every subsequent design decision.

