Creating a customer journey map is a common practice for organizations seeking to understand their clients. However, many teams find themselves stuck in the visualization phase. They have diagrams, touchpoints, and emotional graphs, yet the business impact remains stagnant. A map is a static representation; it is not a strategy. The true value lies not in the drawing, but in the translation of those visual insights into concrete operational changes.
This guide explores how to move past the creation stage and enter the execution phase. We will examine how to validate findings, prioritize interventions, align stakeholders, and measure outcomes without relying on specific tools or buzzwords. The goal is to build a culture where customer data drives daily decisions.
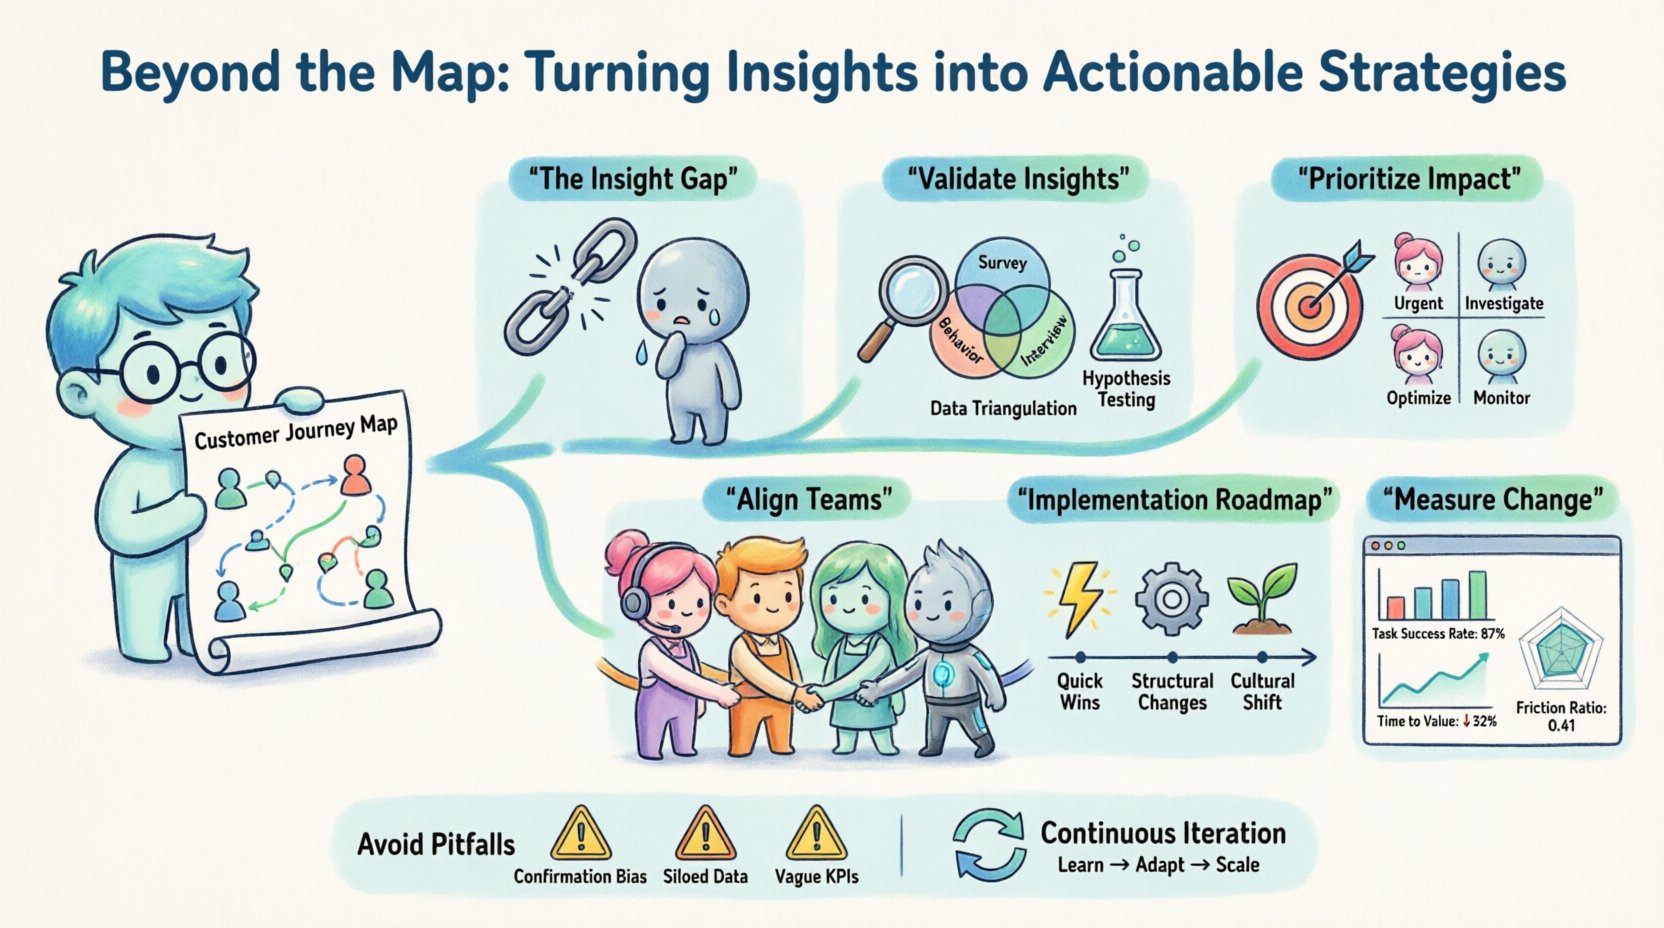
📉 The Insight Gap: Why Maps Often Fail to Drive Change
Many organizations treat journey mapping as a one-off workshop activity. A team gathers, creates a visual, pins it to a wall, and files it away. When a problem arises later, the map is forgotten. This creates a gap between what is known and what is done.
To bridge this gap, we must understand why this disconnect happens:
- Lack of Ownership: Who is responsible for the friction points identified? Without an owner, issues remain unresolved.
- Insufficient Data: Maps based on assumptions rather than evidence lead to incorrect solutions.
- Isolation: If the map exists only in the marketing or experience department, product and support teams do not adapt their workflows.
- Static Nature: Customer behaviors change. A map created six months ago may no longer reflect current reality.
Turning insights into action requires treating the map as a living document. It must be integrated into regular planning cycles and performance reviews.
🔍 Validating Insights Before Acting
Before committing resources to fix a problem, you must verify that the problem exists as described. Acting on a misinterpretation of the journey wastes budget and confuses the customer.
1. Triangulate Your Data
Never rely on a single source of information. Combine qualitative feedback with quantitative metrics to get a full picture.
- Direct Feedback: Interview data, support tickets, and voice of customer (VoC) programs.
- Behavioral Data: Analytics, drop-off rates, and session recordings.
- Operational Data: Processing times, error rates, and service level agreements (SLAs).
2. Hypothesis Testing
Frame every insight as a hypothesis. For example, “Customers abandon the checkout process because the form is too long.” Instead of immediately redesigning the form, test a variation. Run a small pilot to see if the change moves the needle before a full rollout.
3. The Severity Matrix
Not all insights are created equal. Use a framework to categorize friction points based on frequency and impact.
| Category | Definition | Action Priority |
|---|---|---|
| High Frequency / High Impact | Occurs often and causes significant drop-off or frustration. | Immediate Action |
| Low Frequency / High Impact | Occurs rarely but ruins the experience for those who encounter it. | Investigate Deeply |
| High Frequency / Low Impact | Occurs often but causes minor annoyance. | Optimization |
| Low Frequency / Low Impact | Minor issues that happen infrequently. | Monitor |
🎯 Prioritizing for Maximum Impact
Resources are finite. You cannot fix every friction point simultaneously. Strategic prioritization ensures you tackle the problems that yield the highest return on investment.
- Revenue Impact: Does fixing this touchpoint directly influence conversion or retention?
- Brand Reputation: Does this interaction define how the customer perceives the company?
- Operational Cost: Does this friction increase the cost to serve the customer?
- Ease of Implementation: Can this be solved quickly, or does it require a long-term architectural change?
Consider using a weighted scoring model. Assign scores to each potential initiative based on the criteria above. This removes emotion from the decision-making process and relies on logic.
🤝 Aligning Cross-Functional Teams
A customer journey spans departments. A single interaction often involves marketing, sales, product, support, and billing. If one team moves forward while another remains static, the strategy fails. Alignment is critical.
Breaking Down Silos
Invite representatives from all relevant functions to review the journey map. Ask specific questions:
- Product: “Does the roadmap address the pain points identified here?”
- Support: “Are agents equipped to handle the inquiries at this stage?”
- Marketing: “Are we setting expectations that align with this experience?”
- IT: “Is the infrastructure capable of supporting the desired flow?”
Shared Accountability
Move away from departmental goals to journey-based goals. Instead of a support team aiming for “fast response times,” the shared goal could be “Resolution at First Contact.” This aligns incentives across the organization.
🚀 The Implementation Roadmap
Once insights are validated and priorities set, a structured approach to implementation is necessary. A chaotic rollout leads to confusion. A phased approach allows for learning and adjustment.
Phase 1: Quick Wins (Weeks 1-4)
Identify low-effort, high-impact changes. These might be copy edits, button placements, or policy clarifications. Quick wins build momentum and demonstrate that the initiative is serious.
Phase 2: Structural Changes (Months 2-6)
Address process flows, training programs, or system integrations. This requires more coordination and planning. Stakeholders should be updated regularly on progress.
Phase 3: Cultural Shift (Ongoing)
This involves embedding customer-centricity into hiring, performance reviews, and daily stand-ups. It ensures that the new behaviors persist after the initial project ends.
📊 Measuring Real Change
If you cannot measure the result, you cannot prove the strategy worked. Relying solely on Net Promoter Score (NPS) or Customer Satisfaction (CSAT) is often insufficient. These are lagging indicators. You need leading indicators that reflect the specific journey changes.
- Task Success Rate: Can users complete the specific task without error?
- Time to Value: How long does it take for a new user to experience the core benefit?
- Friction Ratio: The ratio of successful interactions to failed interactions.
- Effort Score: How much work does the customer perceive they are doing to achieve their goal?
Setting Baselines
Before making changes, record the current metrics. Without a baseline, it is impossible to quantify improvement. Ensure data collection methods remain consistent throughout the testing period.
⚠️ Common Pitfalls to Avoid
Even with a solid plan, execution can go wrong. Be aware of these common traps.
- Assuming Universality: One journey does not fit all. Segment your maps by persona. A power user has a different path than a novice.
- Ignoring Internal Experience: Employees cannot deliver a great customer experience if their internal tools are clunky. Employee journey mapping is a precursor to customer journey mapping.
- Over-Engineering: Do not create a map with 50 steps if the customer only takes 5. Simplicity drives adoption.
- Forgetting the Emotional Arc: Focus not just on the steps, but on how the customer feels at each stage. Frustration at step 3 can negate satisfaction at step 4.
🔄 Continuous Iteration
The journey never truly ends. Markets change, competitors emerge, and customer expectations evolve. What works today may not work tomorrow.
Establish a review cadence. Quarterly reviews are standard for checking the health of the journey. During these reviews, ask:
- Have customer behaviors shifted since the last map?
- Did our recent changes produce the expected results?
- Are there new touchpoints that need integration?
- Is the data still accurate?
Treat the strategy as a hypothesis that is constantly being tested and refined. This agility allows the organization to stay ahead of issues before they become major crises.
🏁 Final Thoughts on Execution
Creating a visual representation is easy. Changing the behavior of an organization is difficult. The difference between a map that sits on a shelf and a strategy that drives growth is execution.
By validating data, prioritizing wisely, aligning teams, and measuring rigorously, you transform insights into tangible outcomes. The map is merely the starting point. The destination is a customer experience that is consistent, efficient, and valued.
Start small. Pick one critical journey. Apply these principles. Measure the result. Then scale. The path forward is built step by step, not all at once.

